Appendix 7: Chapter 8 Supplemental Figures and Tables
Figure A7.1
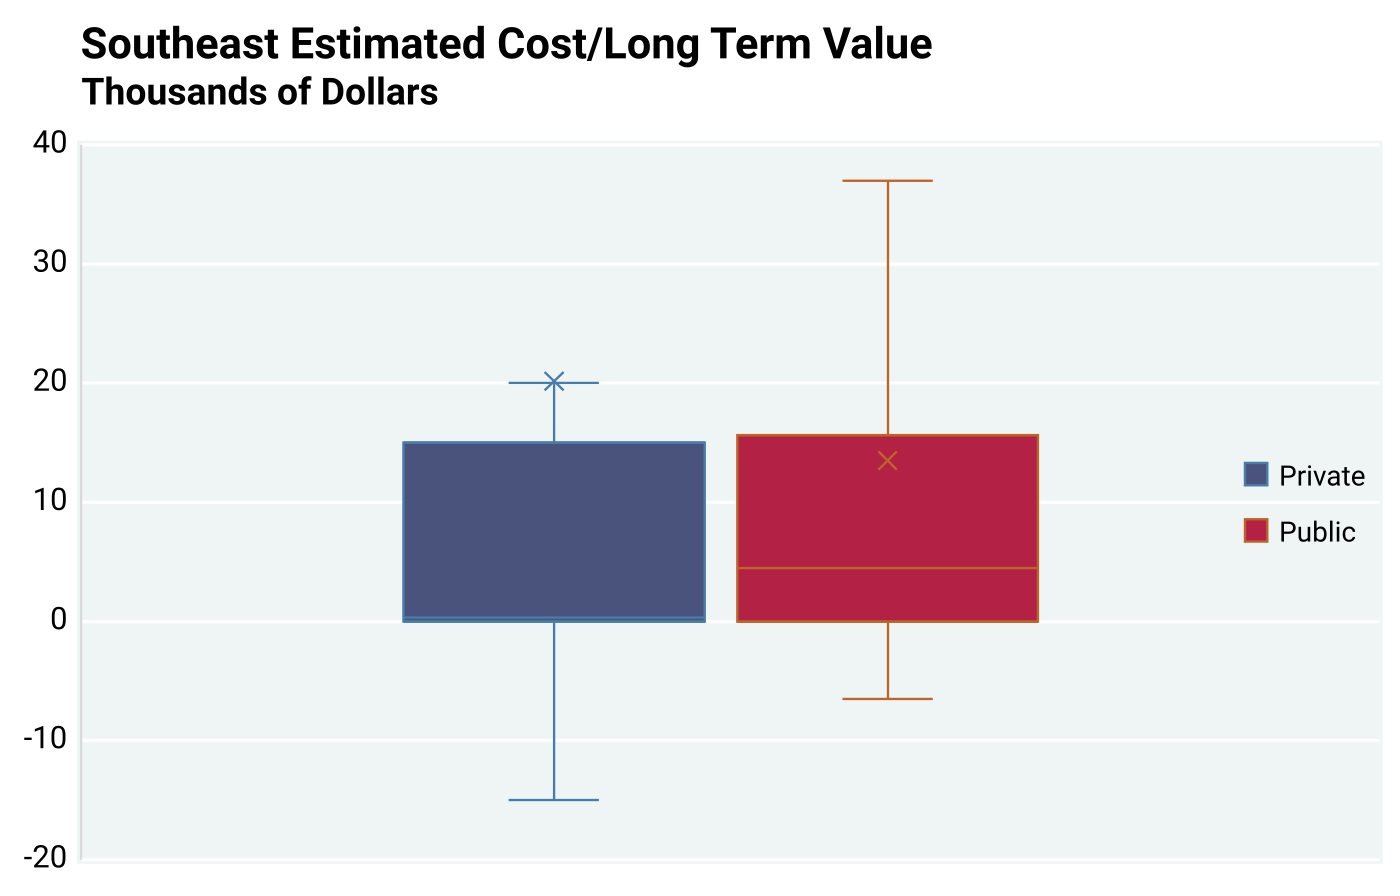
Figure A7.2
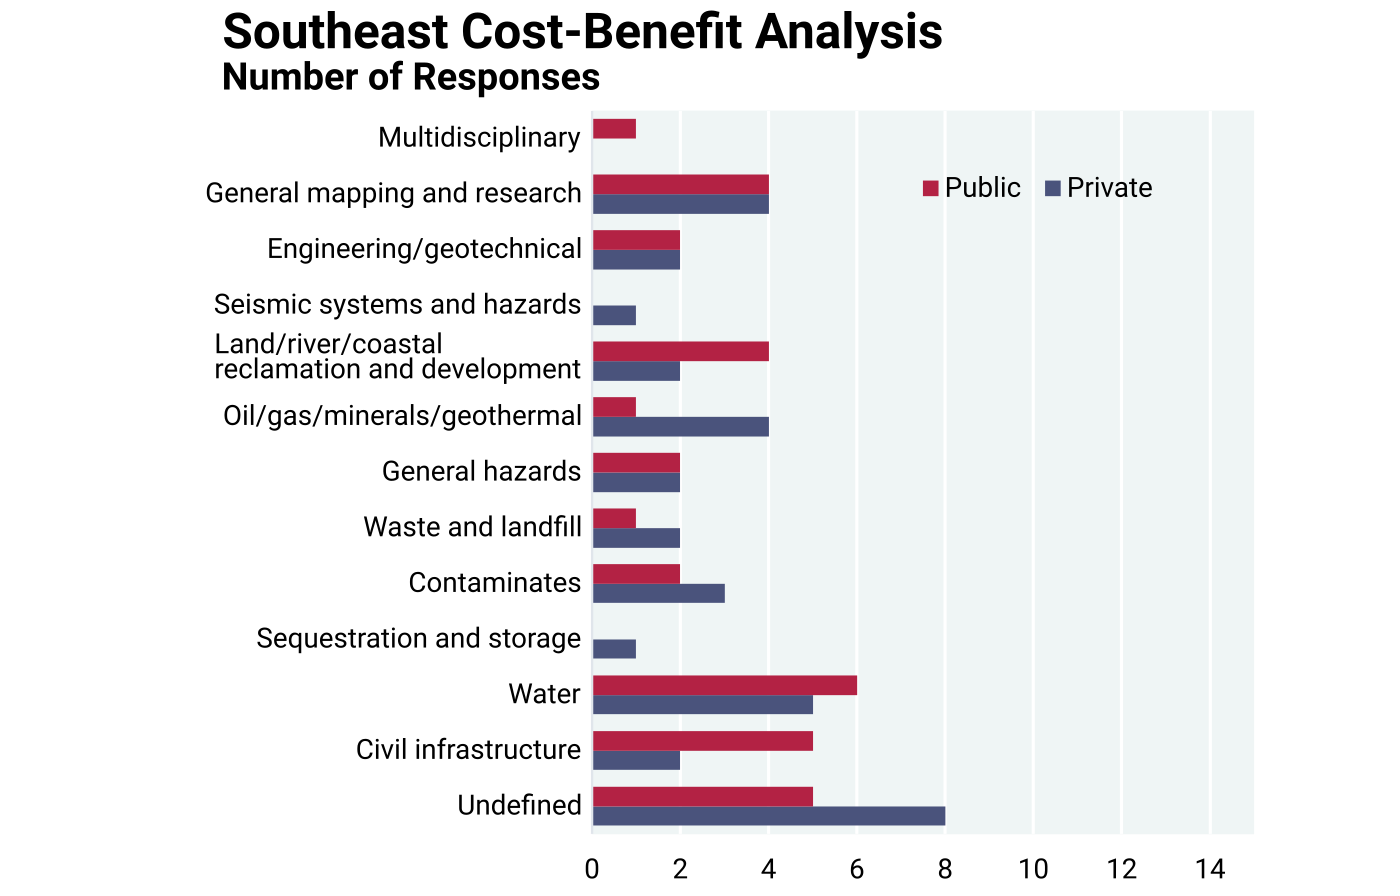
Figure A7.3
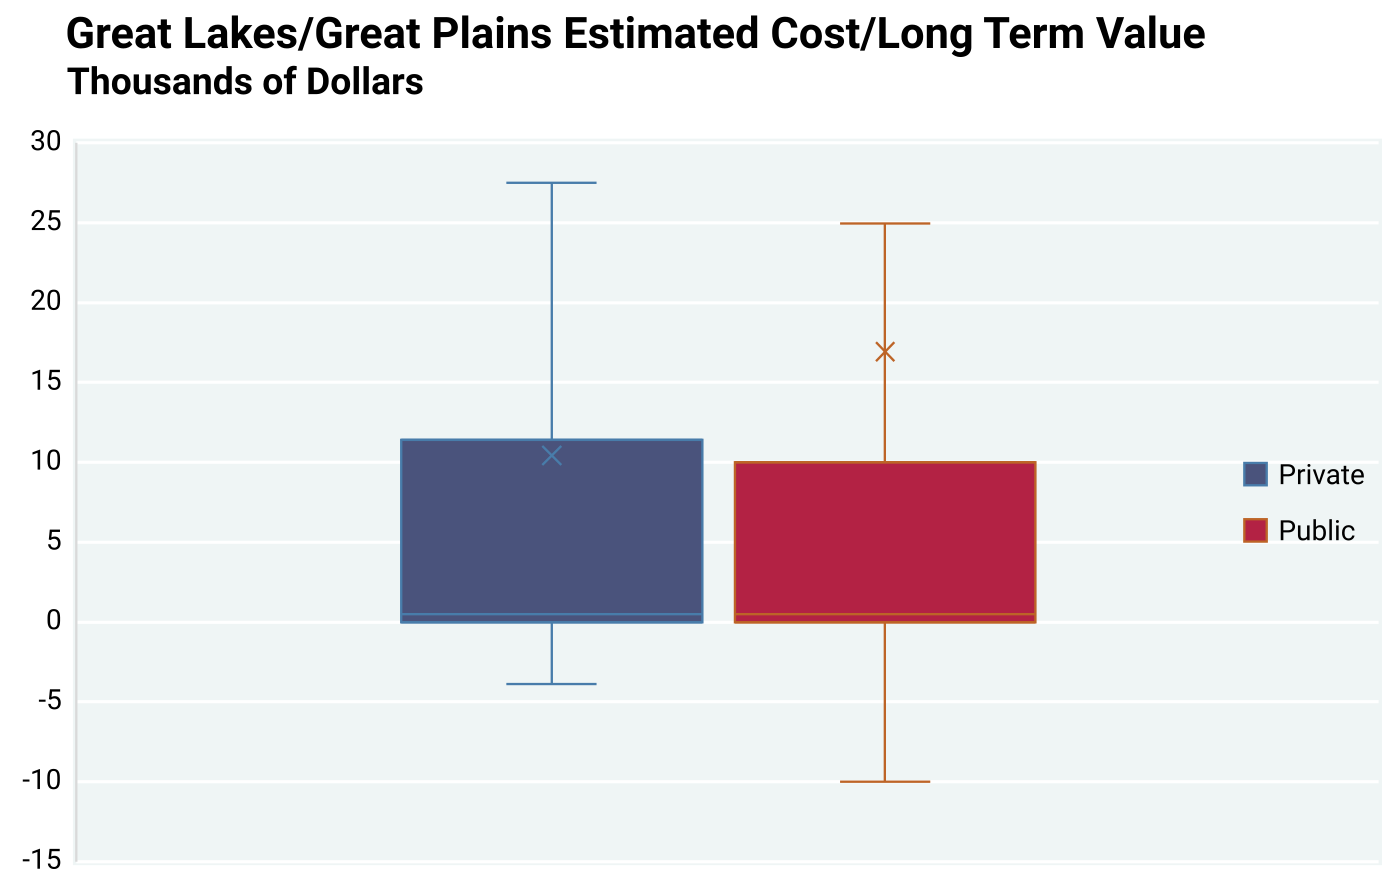
Figure A7.4
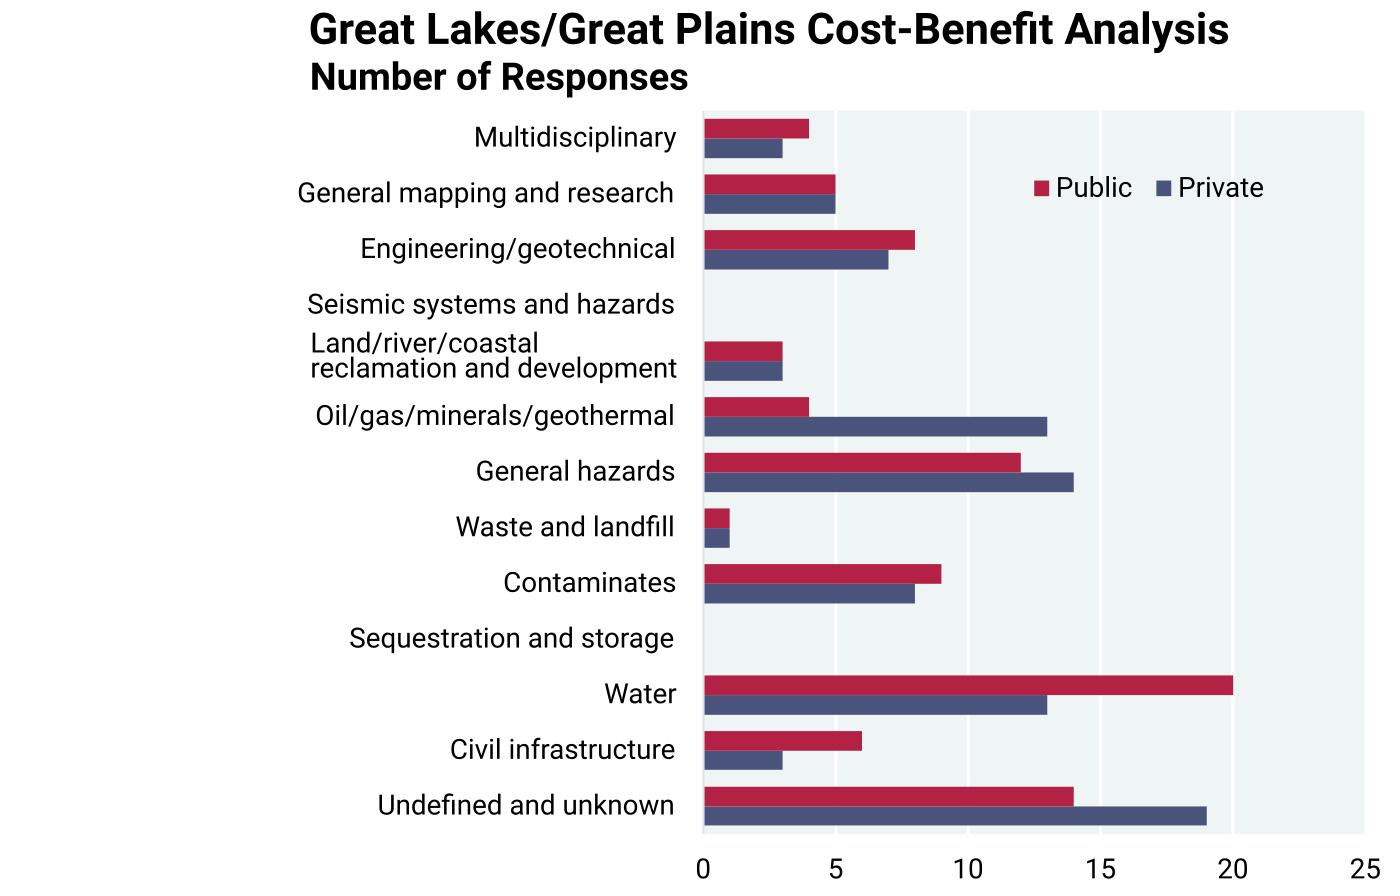
Figure A7.5
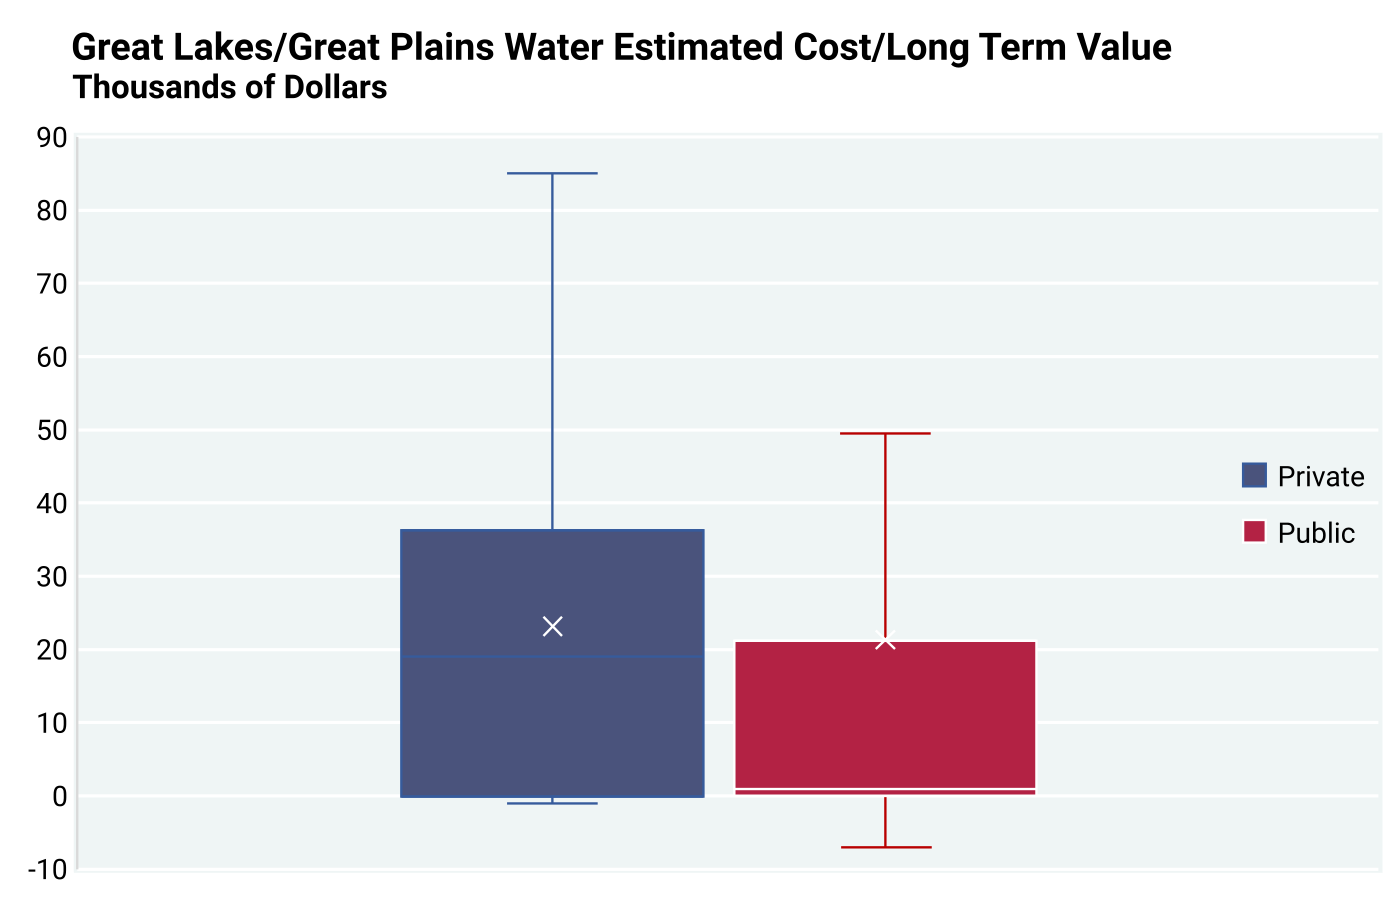
Figure A7.6
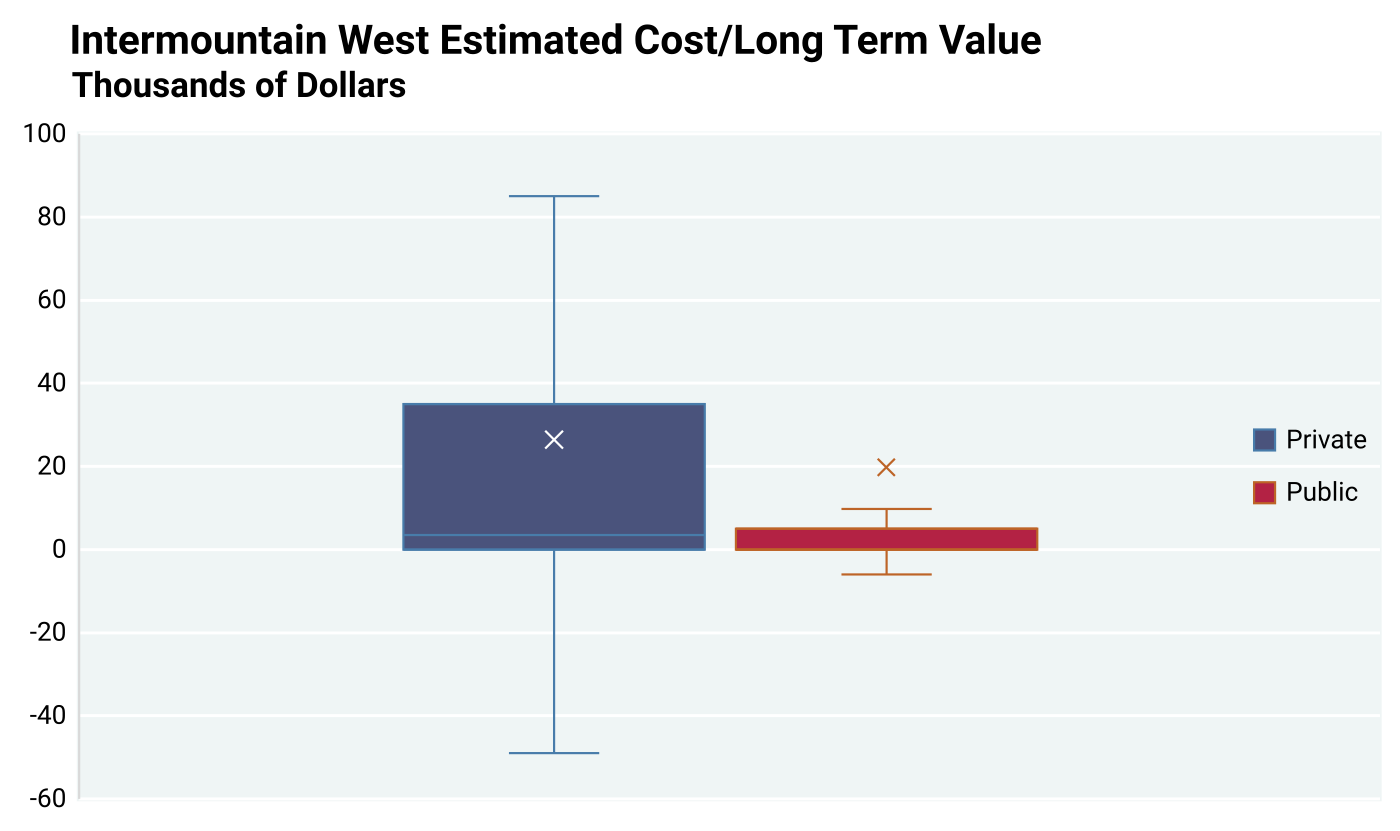
Figure A7.7
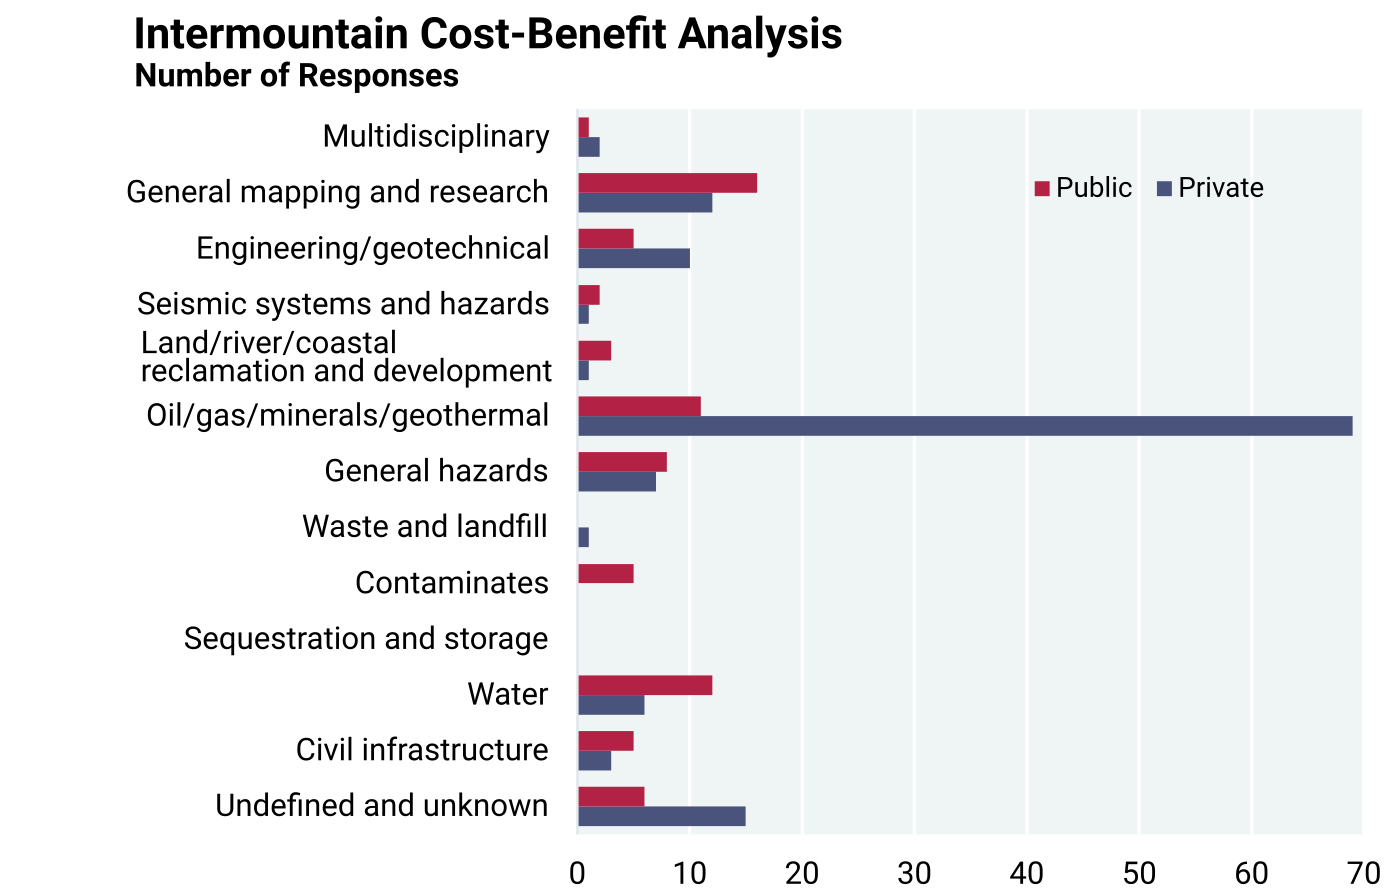
Figure A7.8
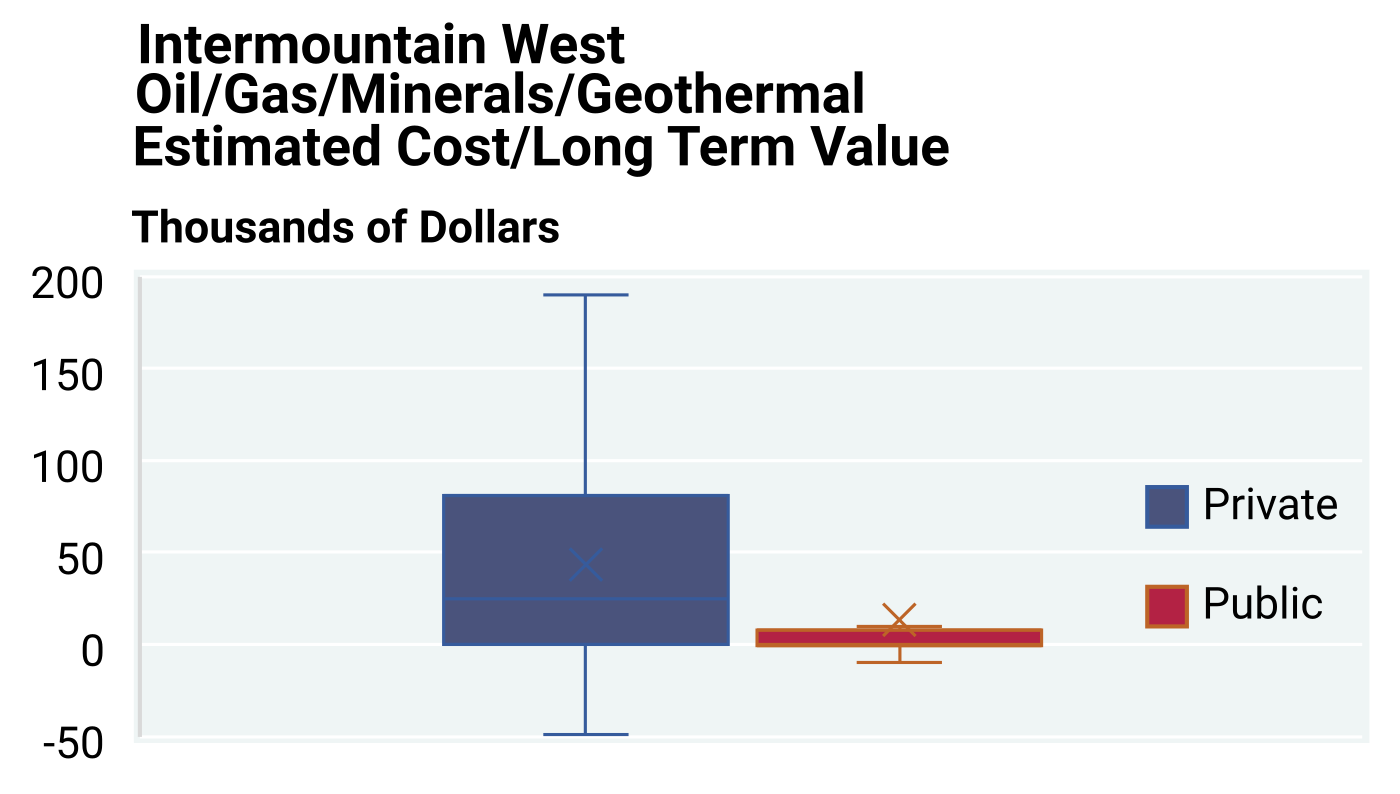
Figure A7.9
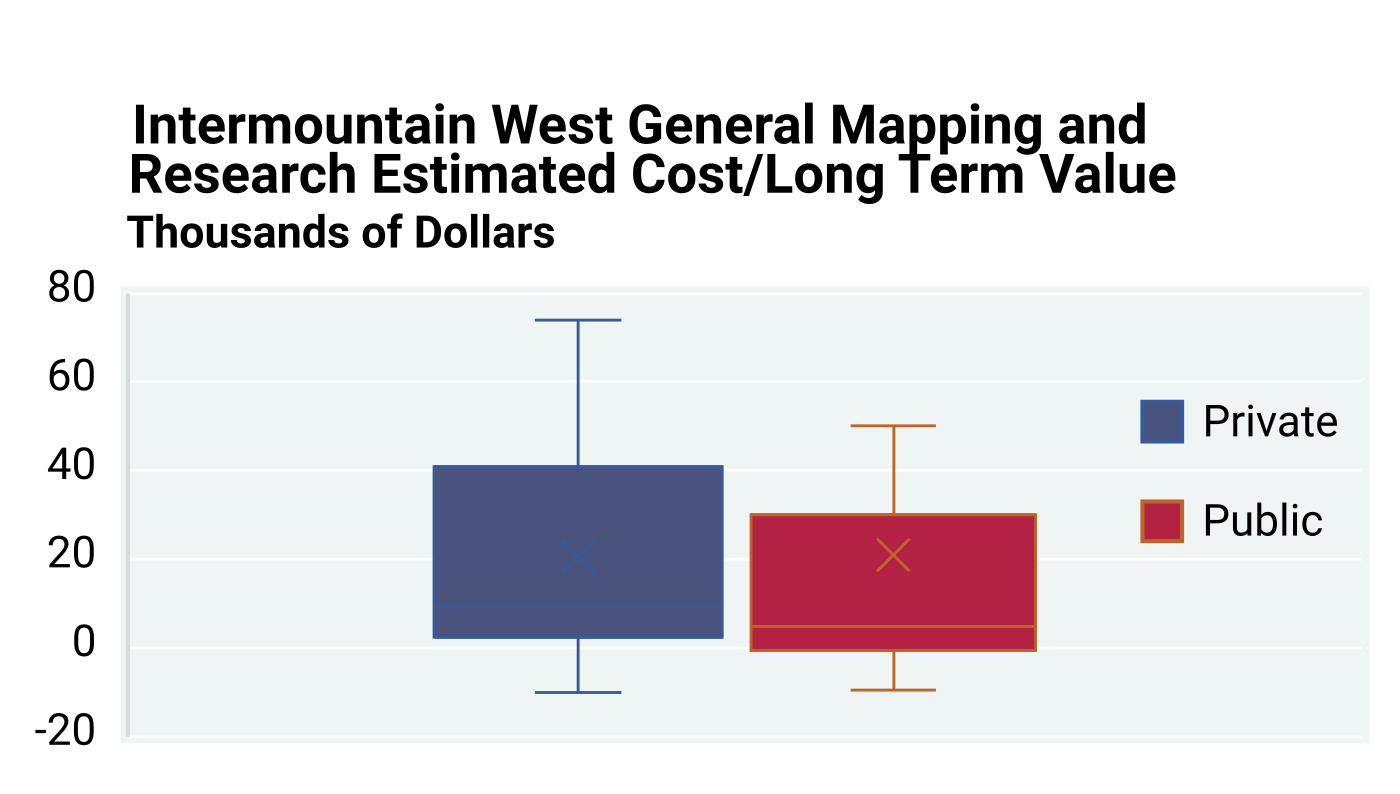
Figure A7.10
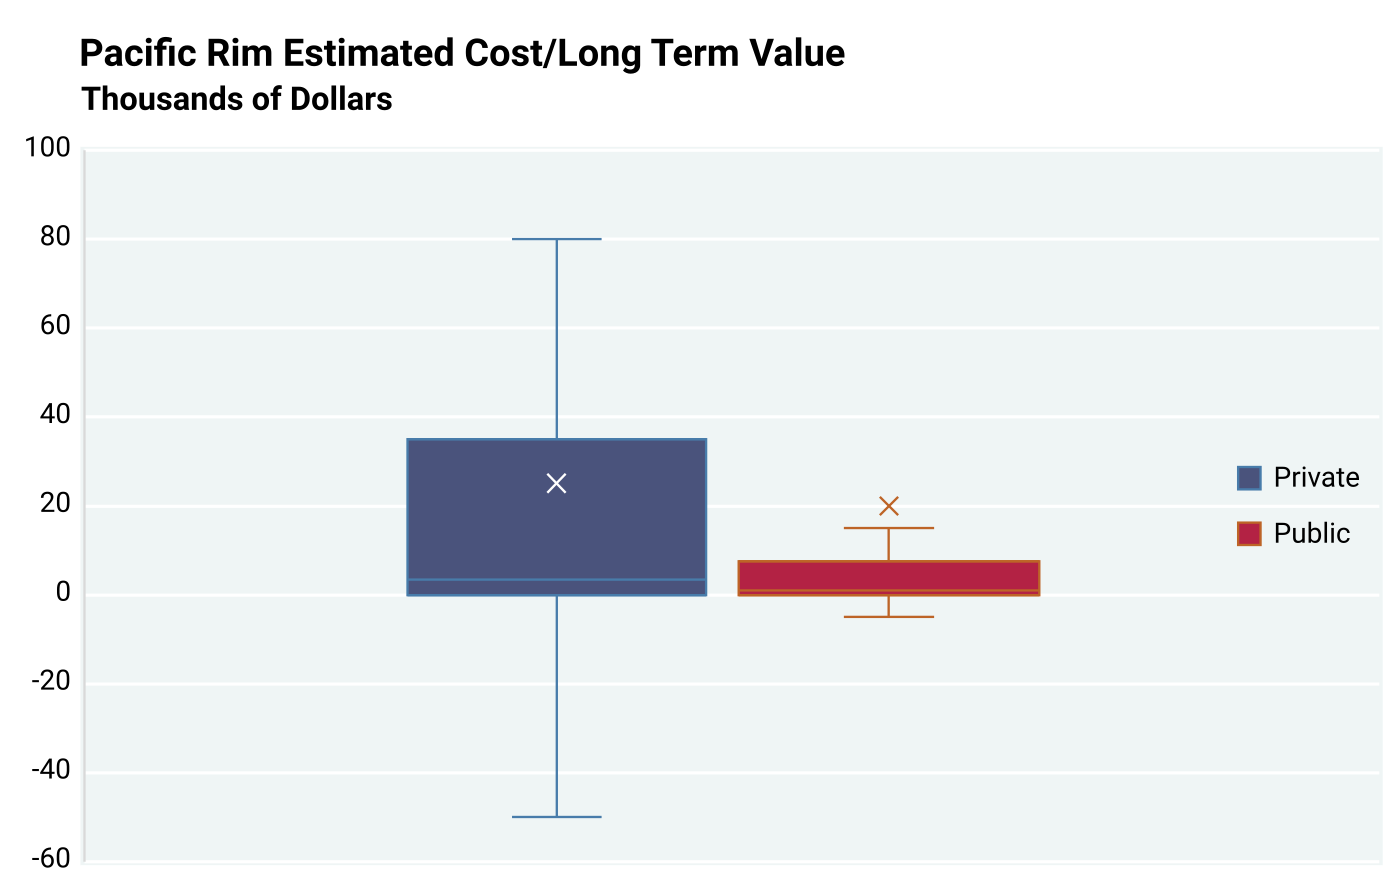
Figure A7.11
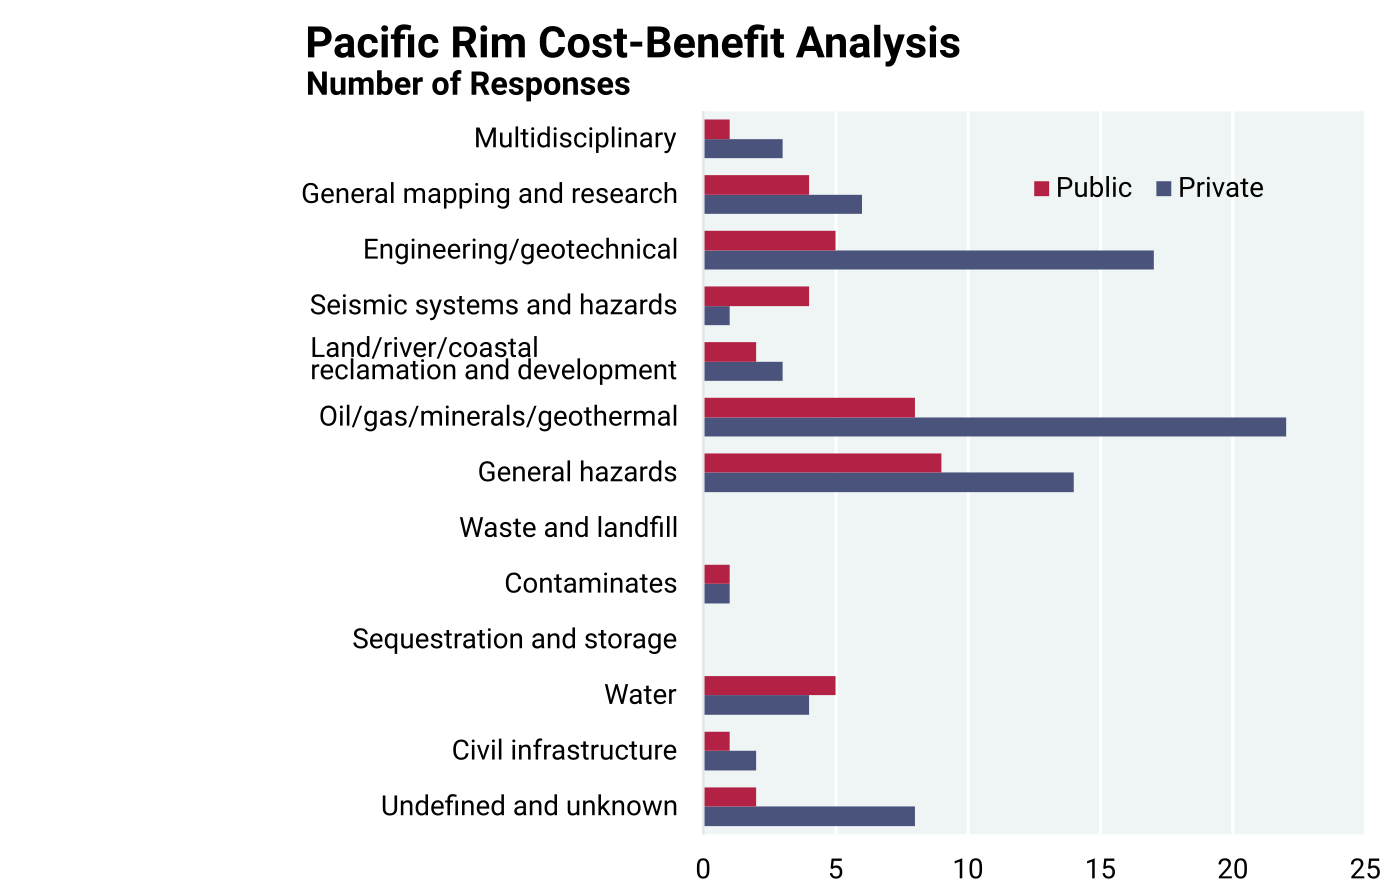
Figure A7.12
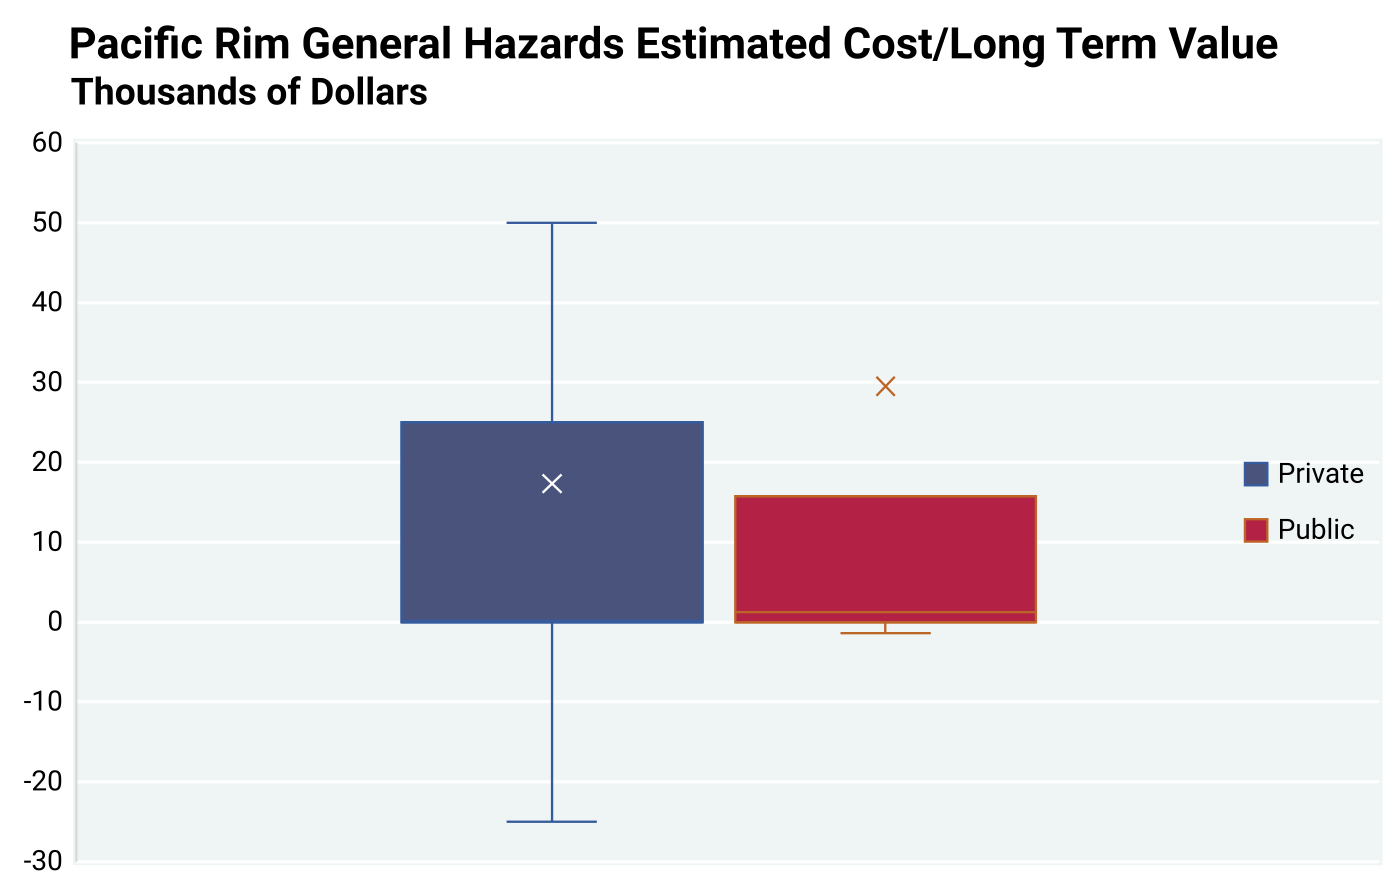
Figure A7.13
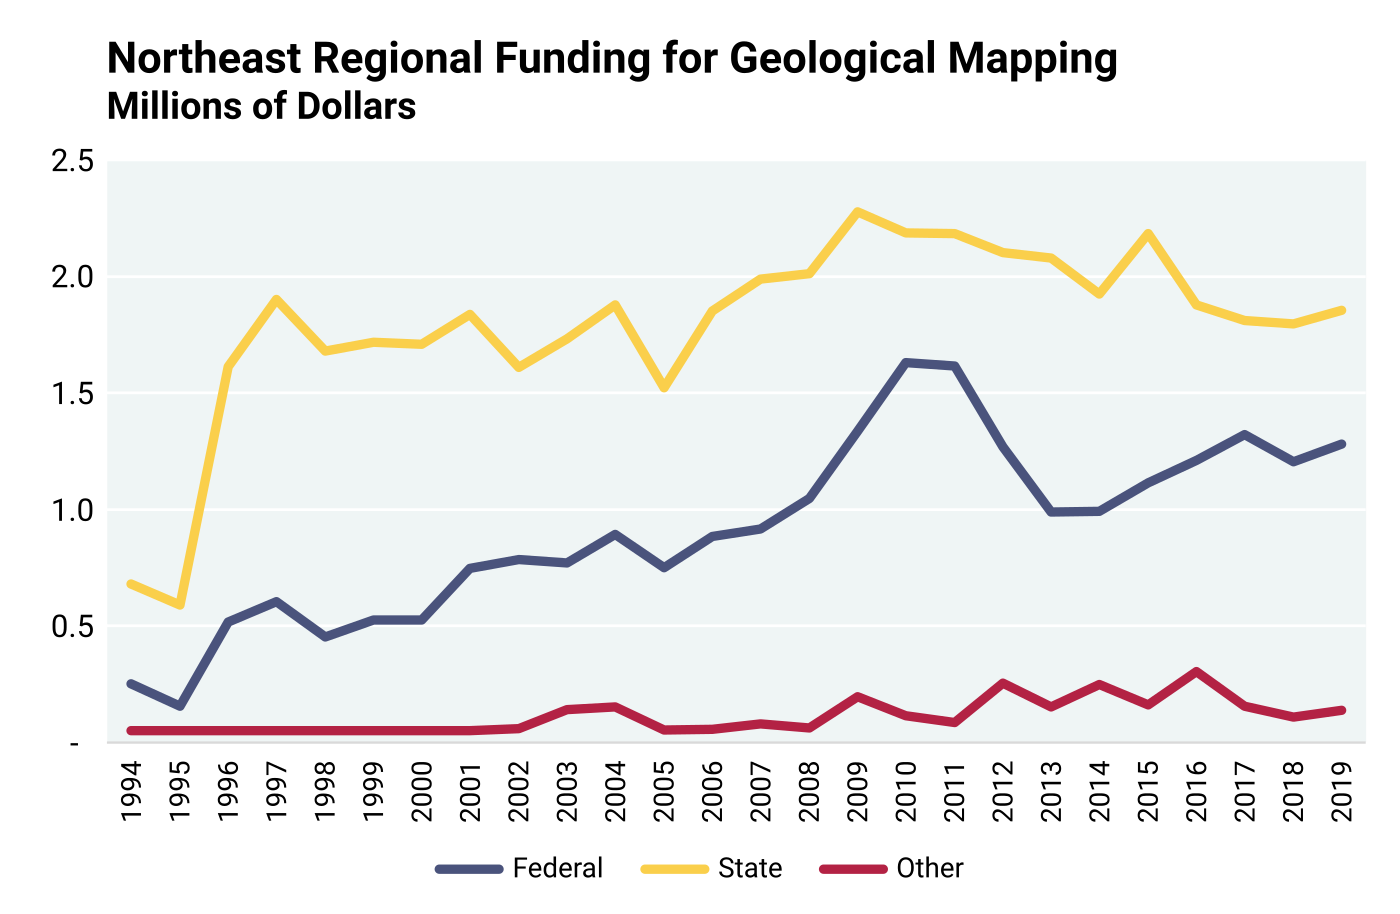
Figure A7.14
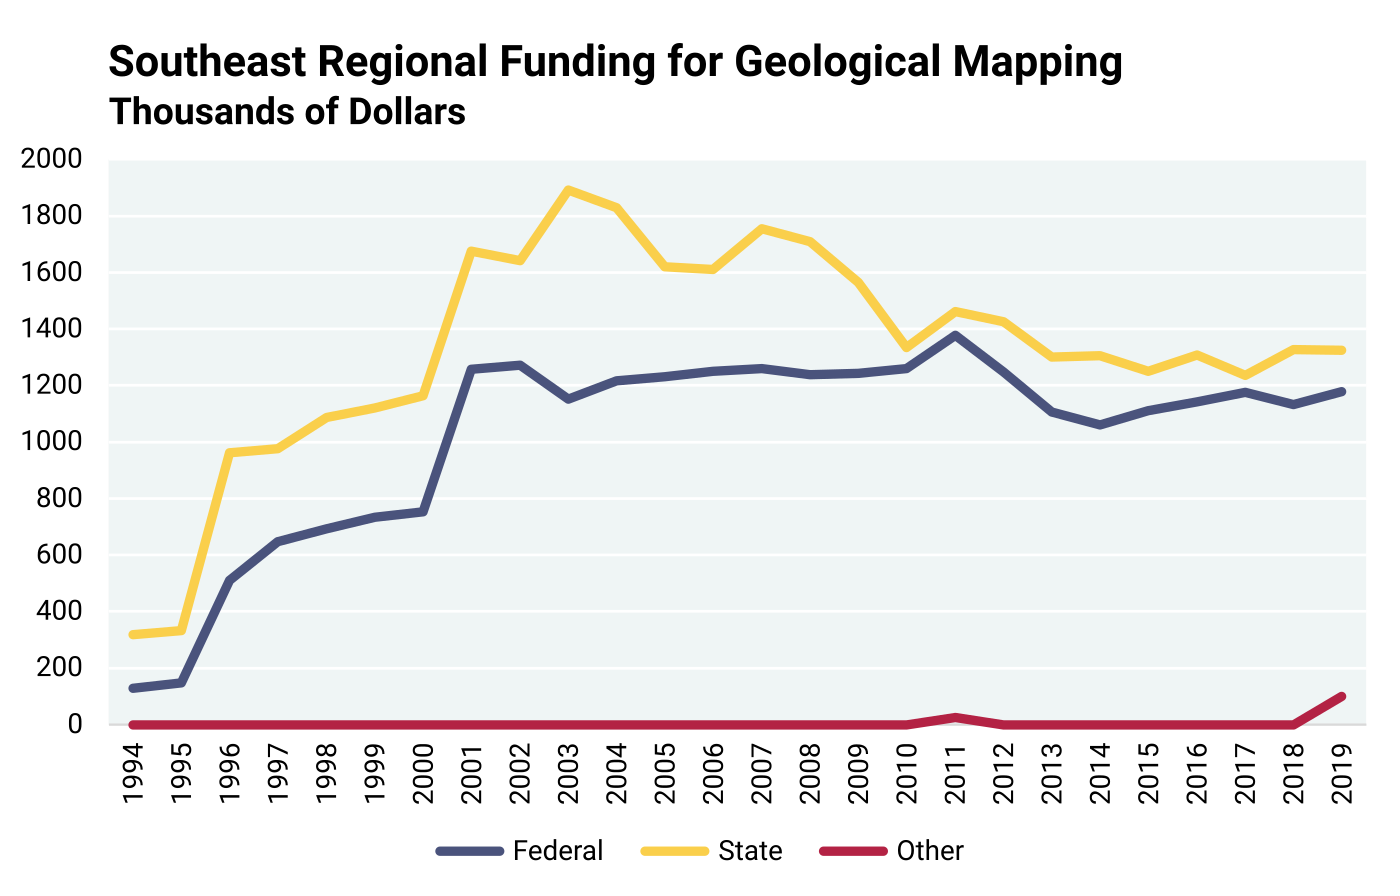
Figure A7.15
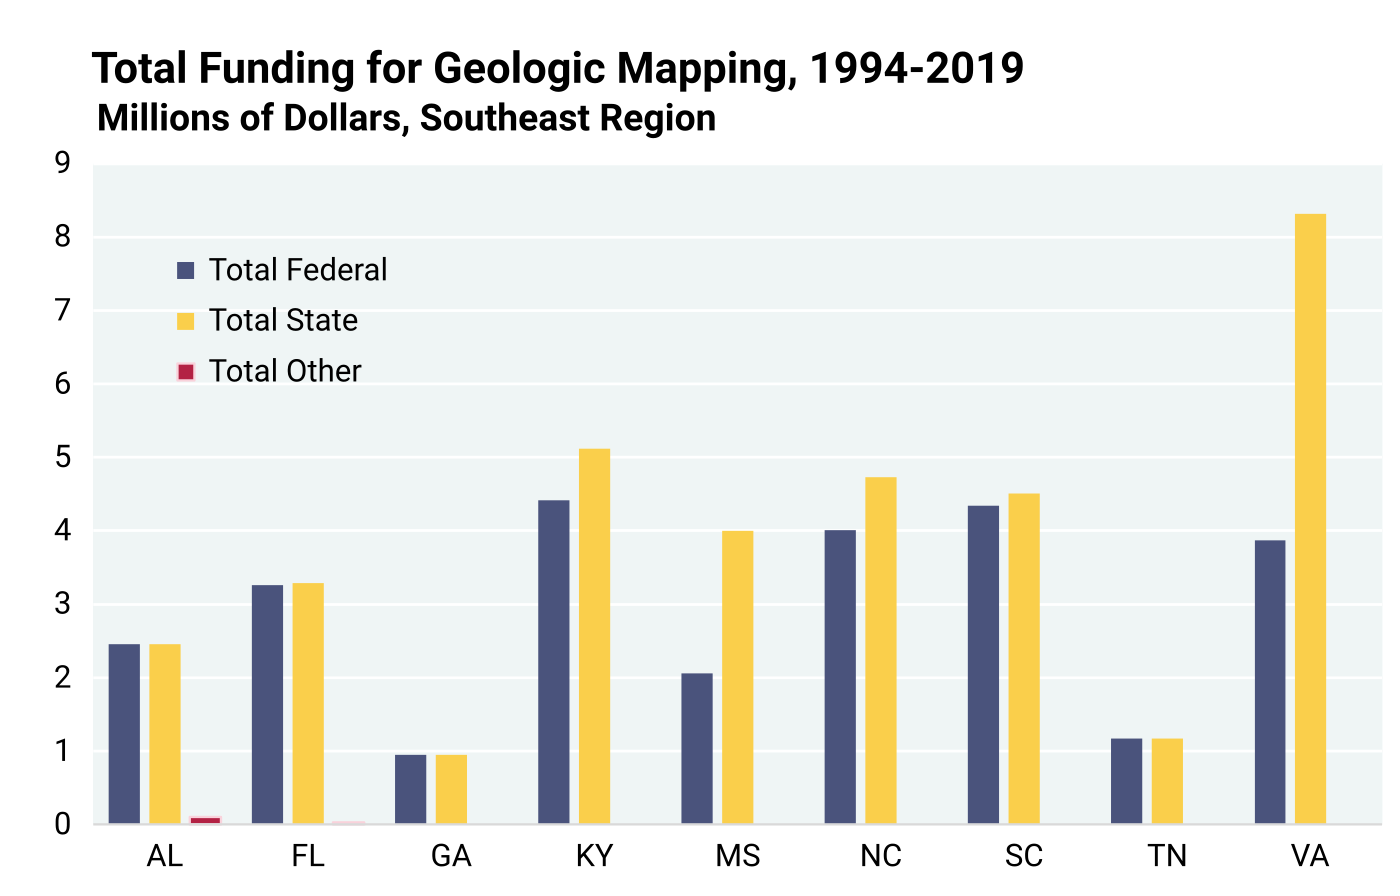
Figure A7.16
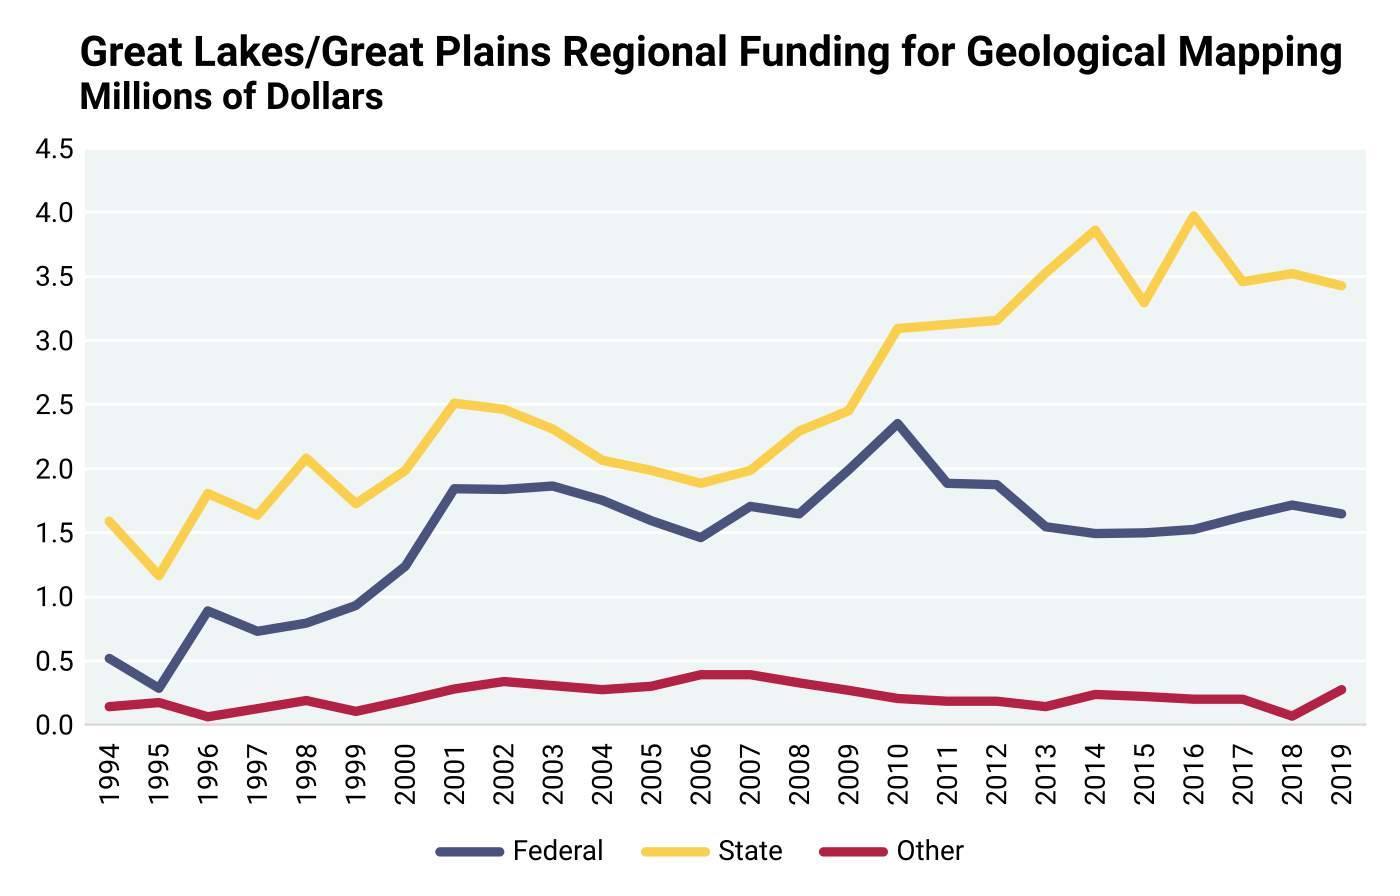
Figure A7.17
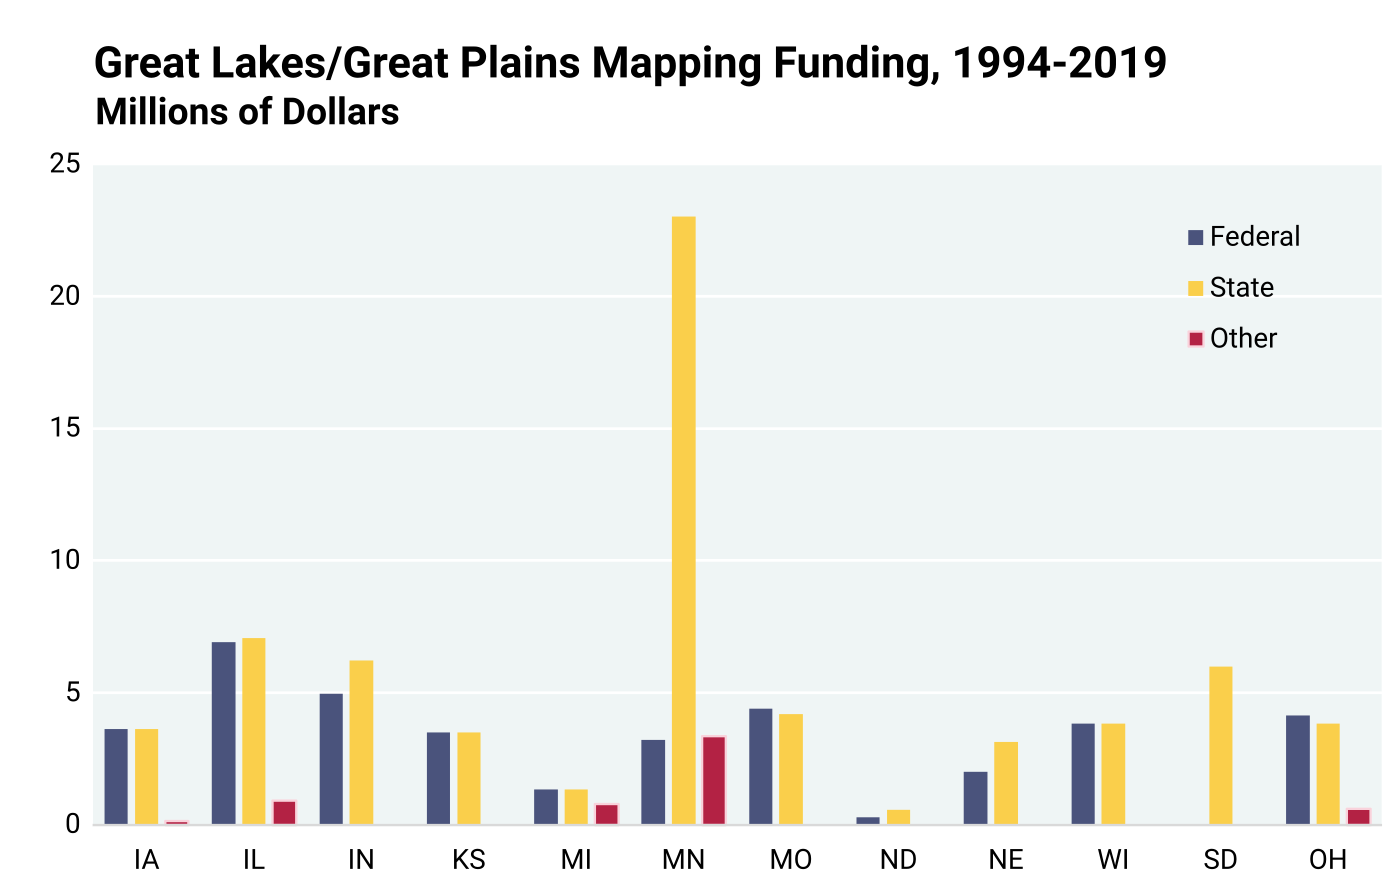
Figure A7.18
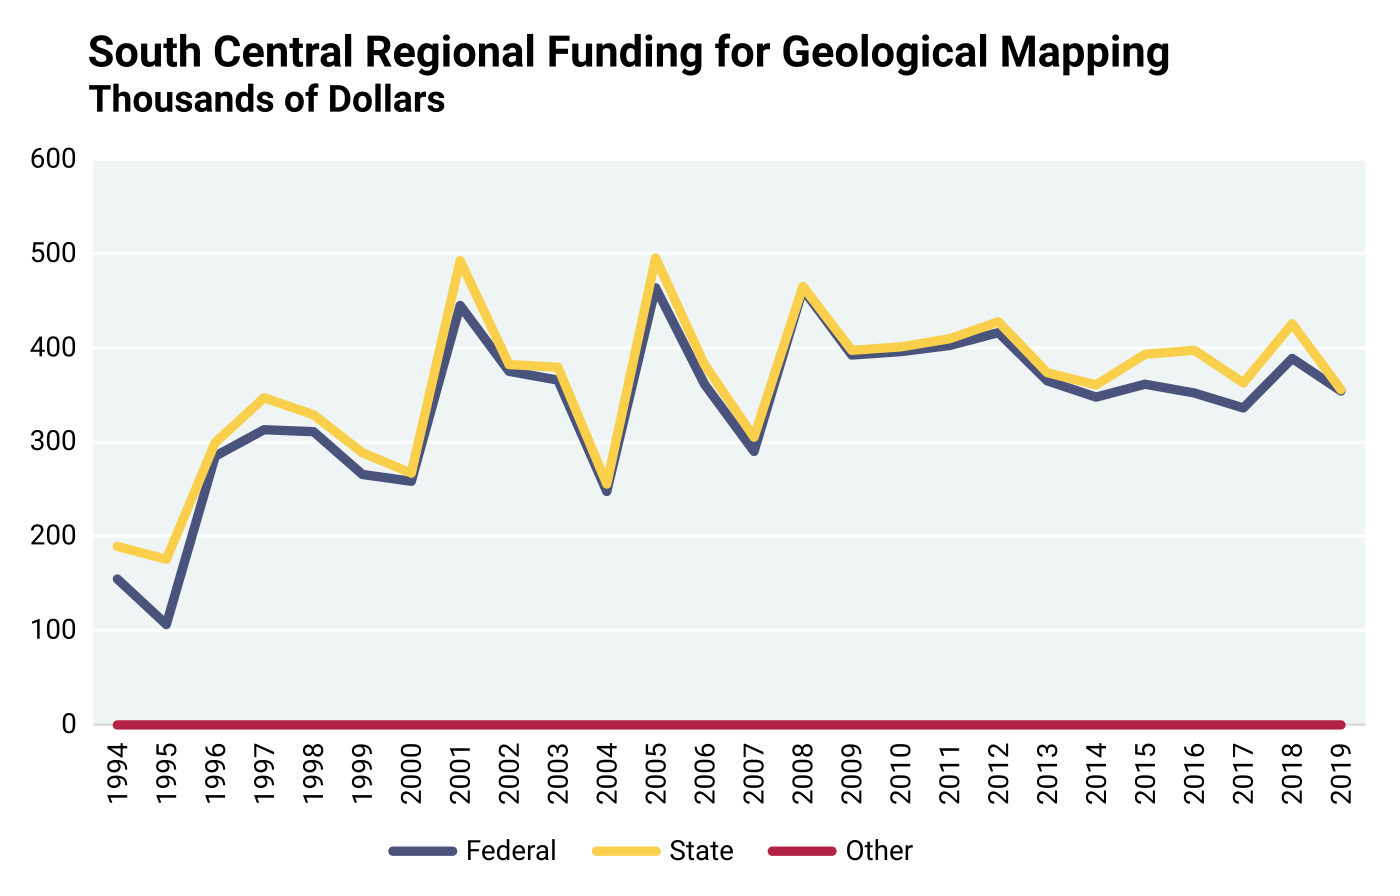
Figure A7.19
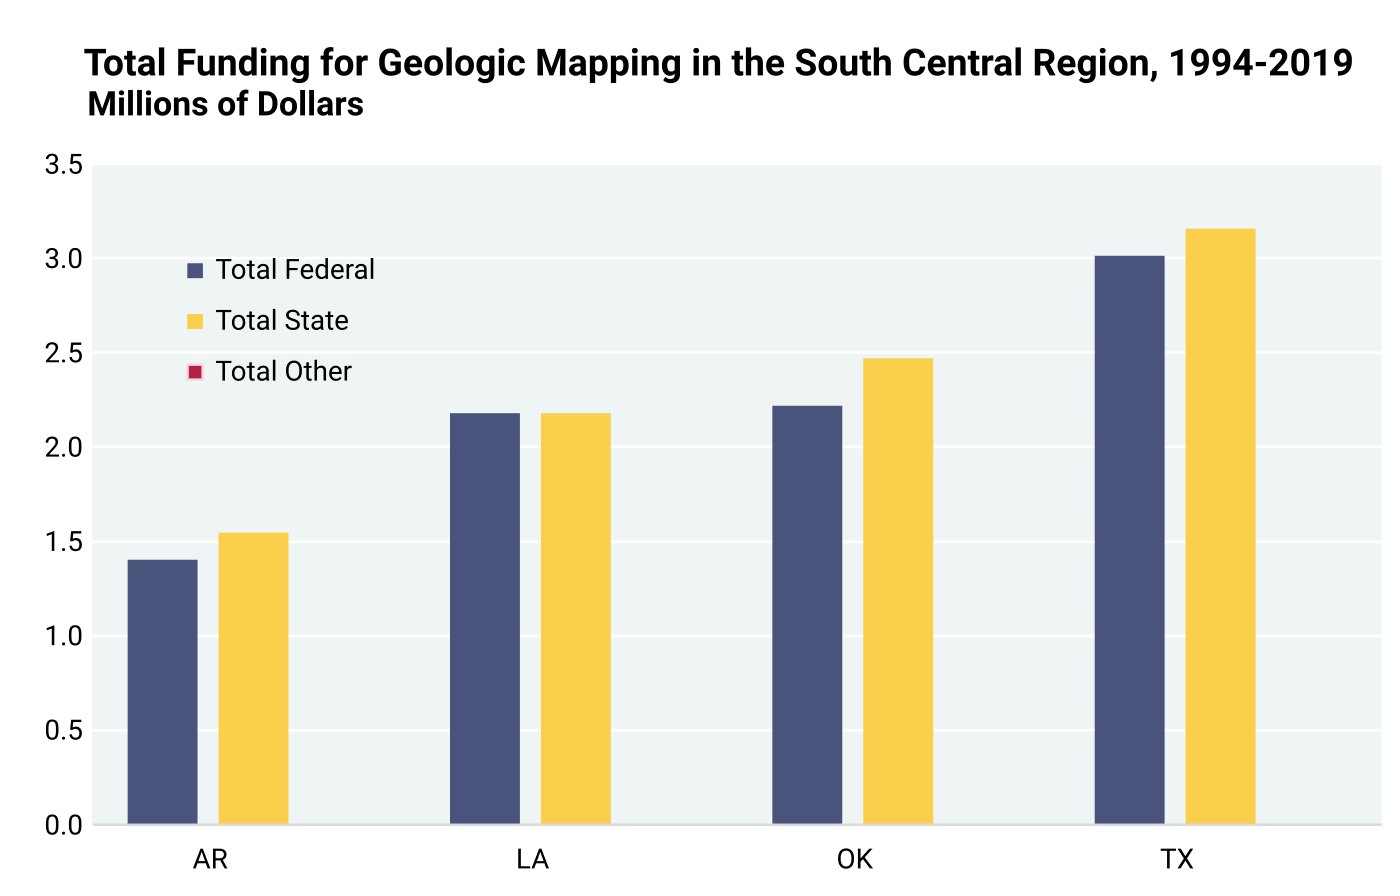
Figure A7.20
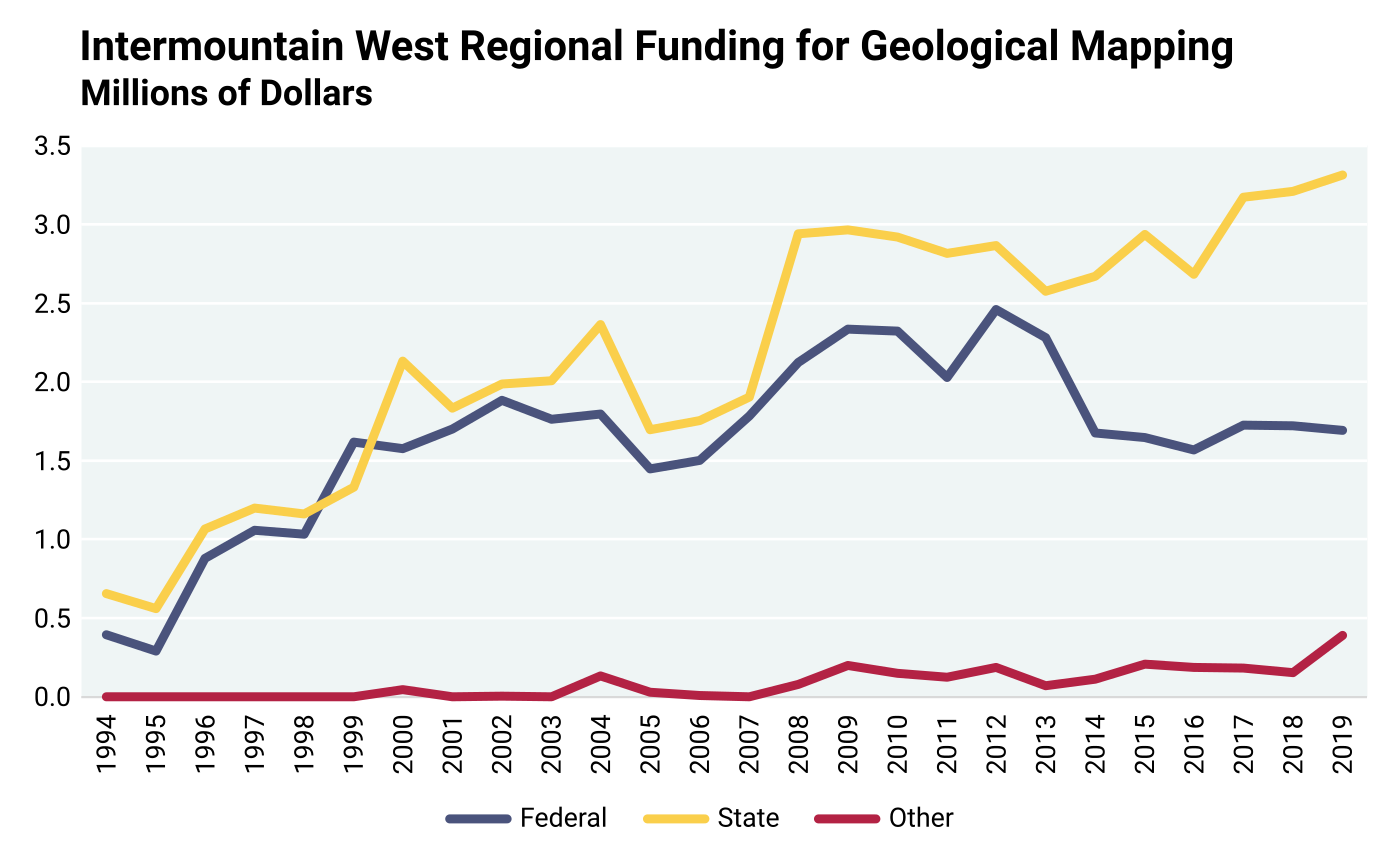
Figure A7.21
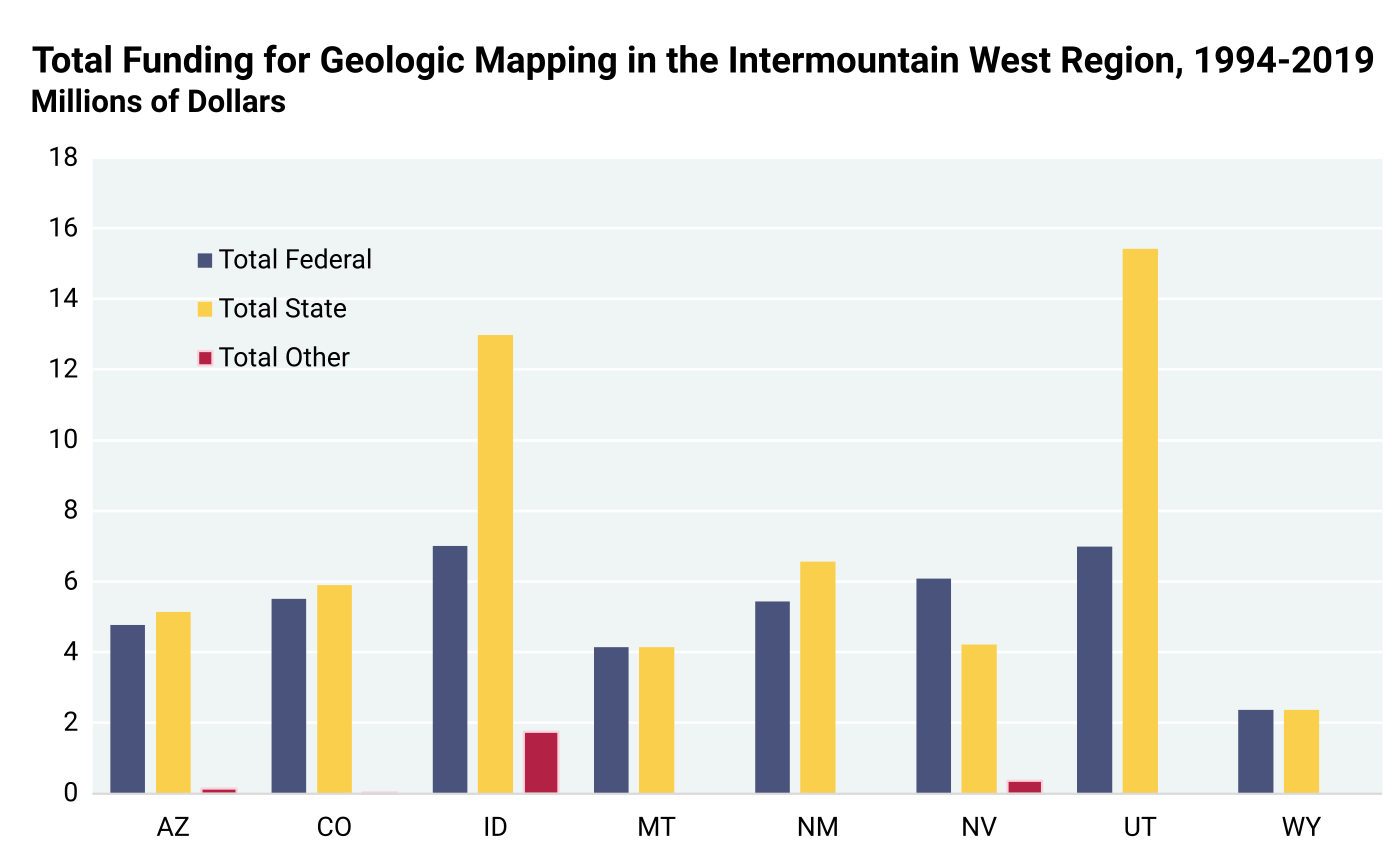
Figure A7.22
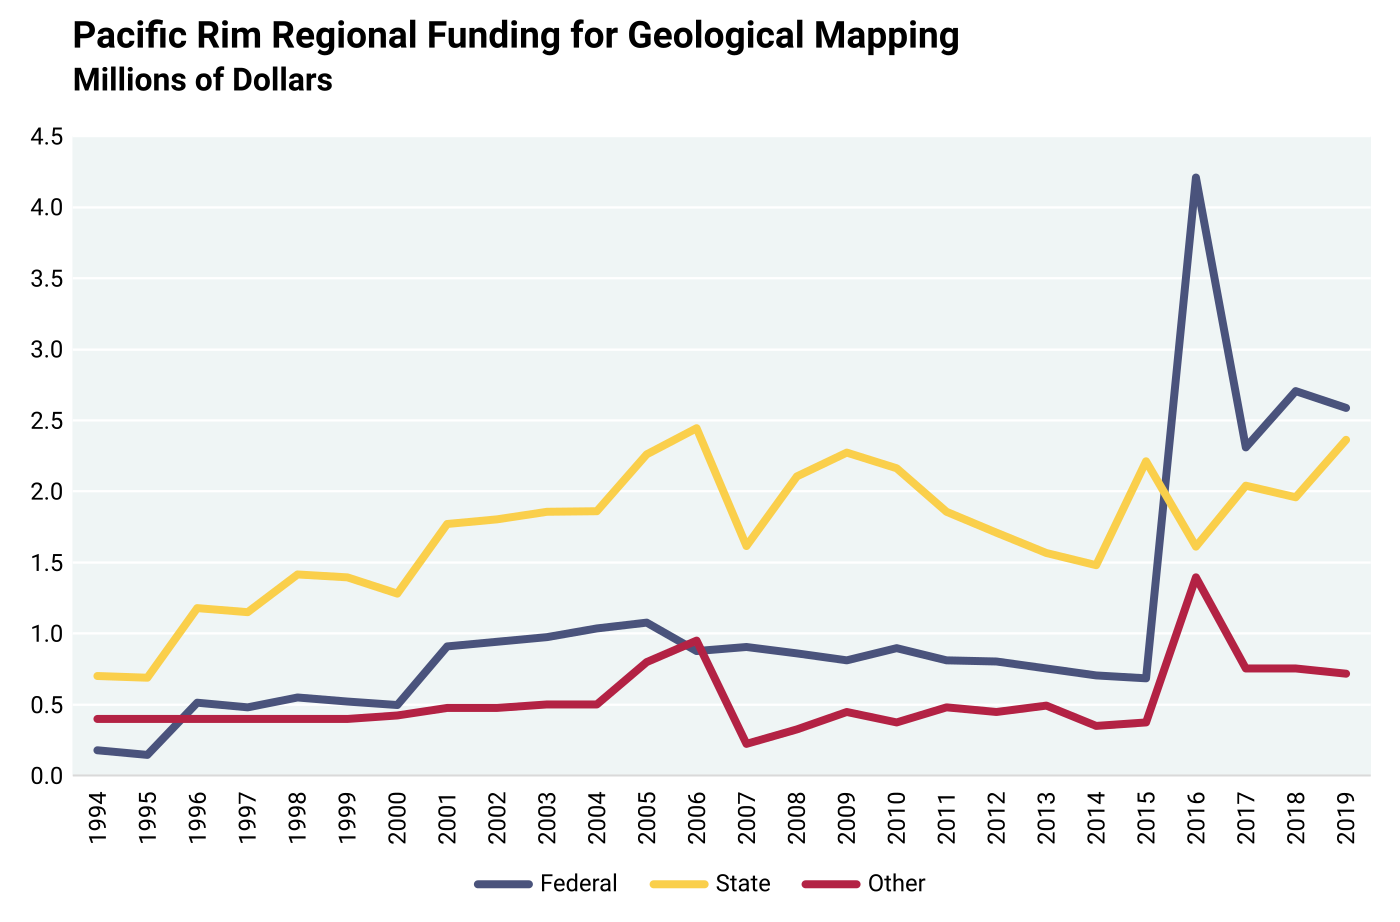
Figure A7.23
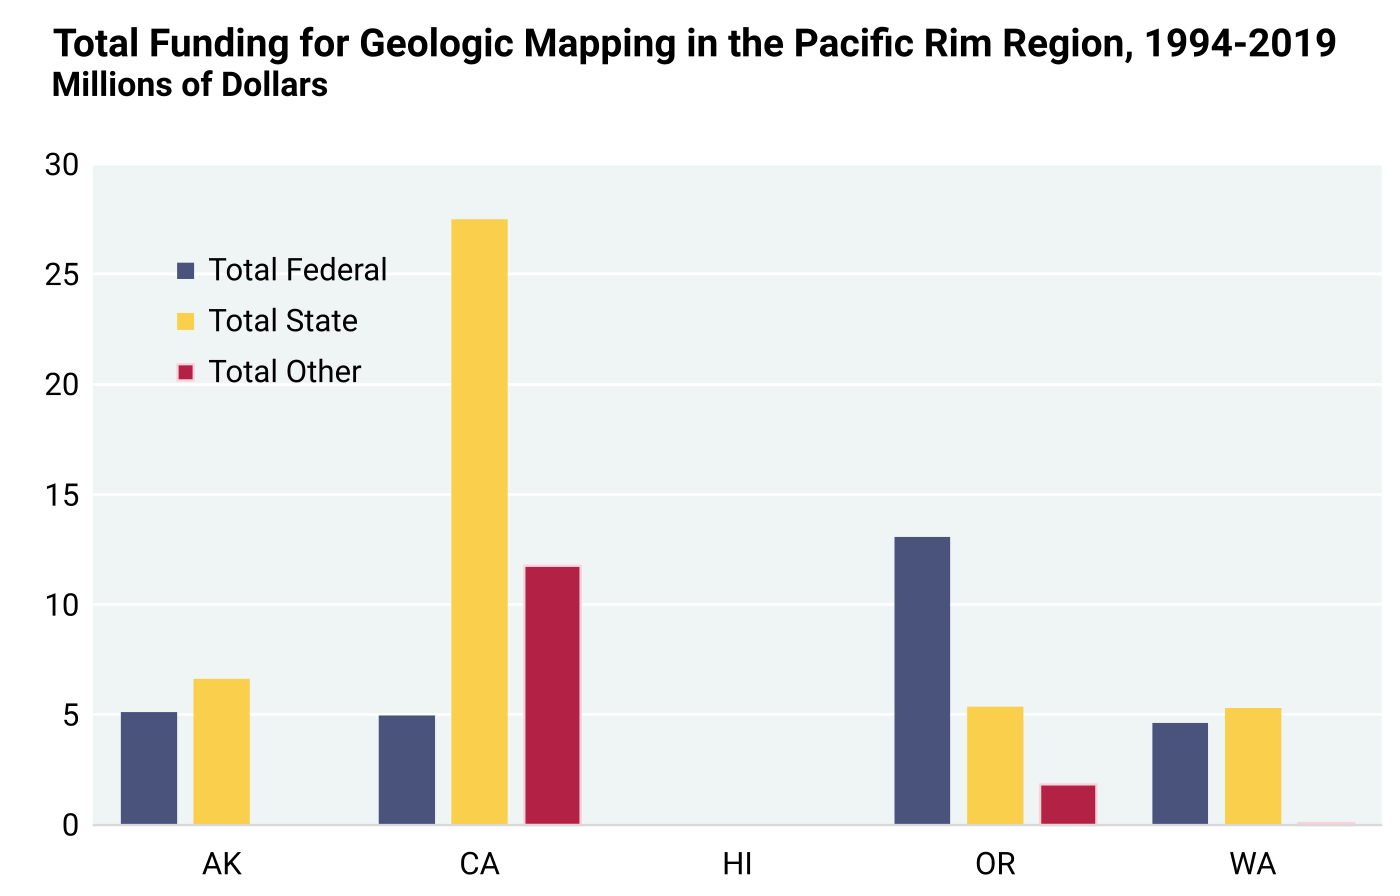
Figure A7.24
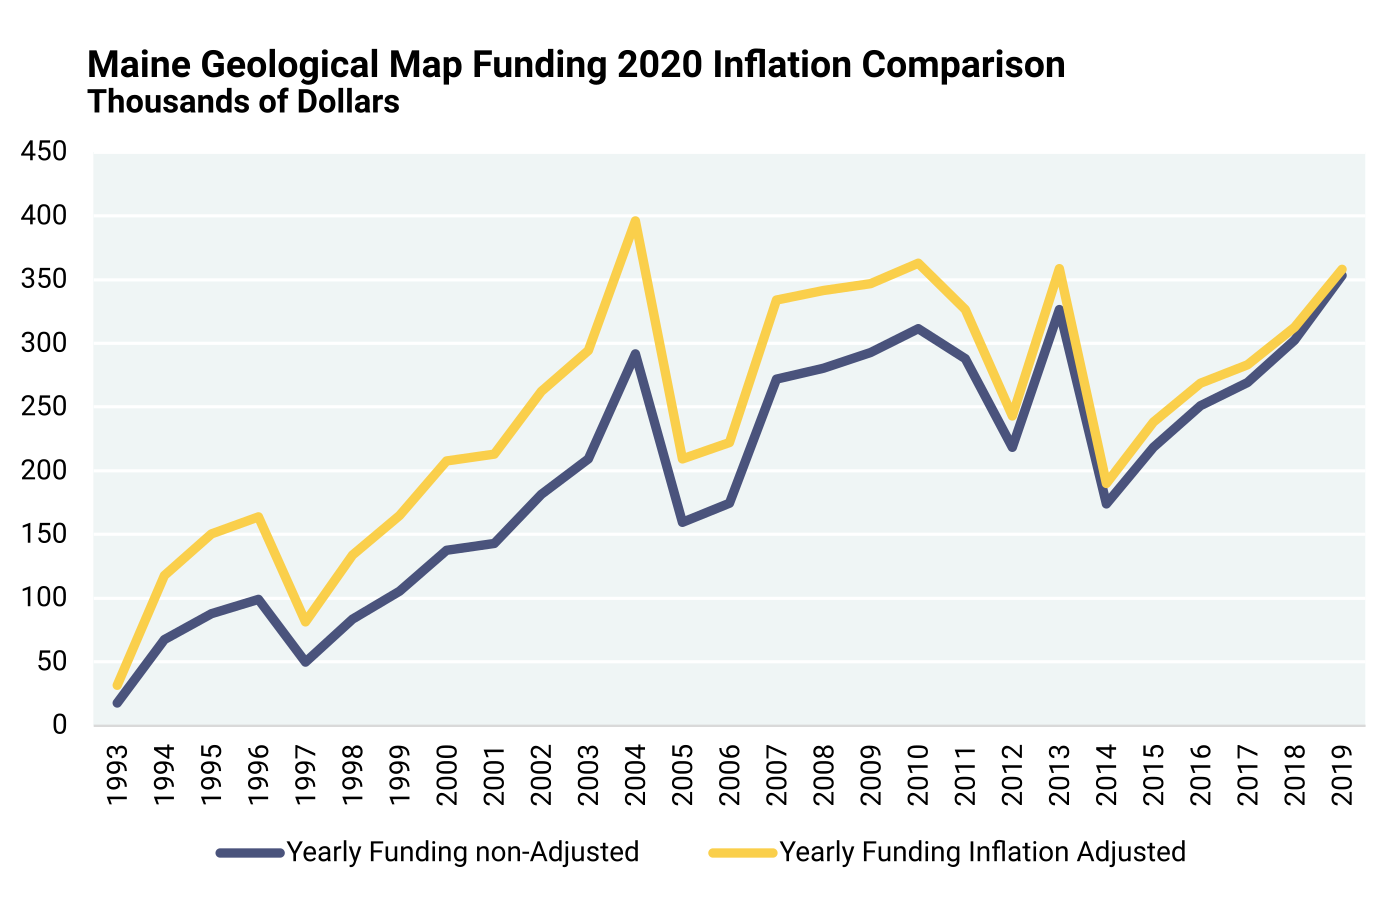
Figure A7.25
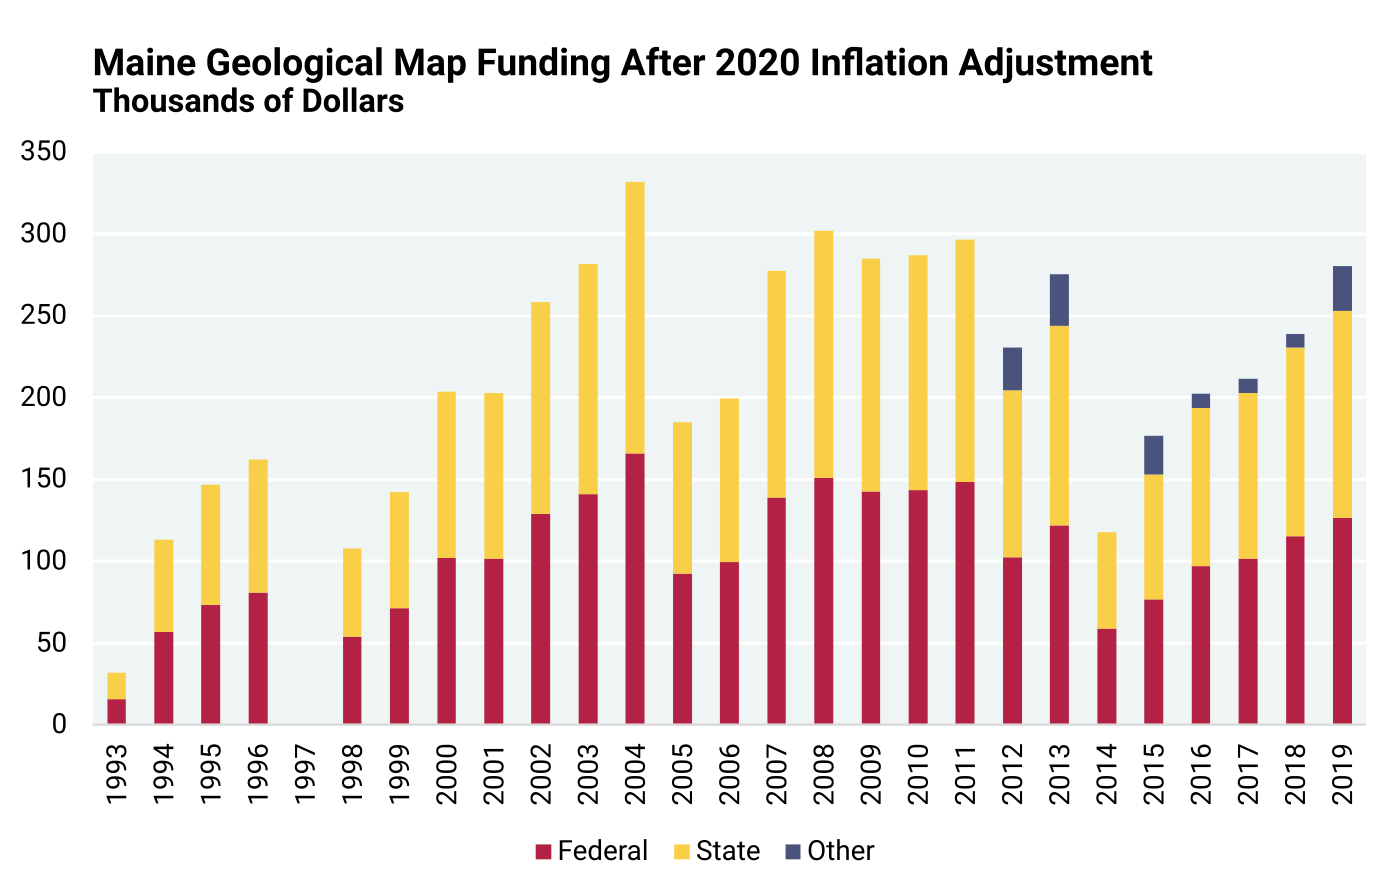
Figure A7.26
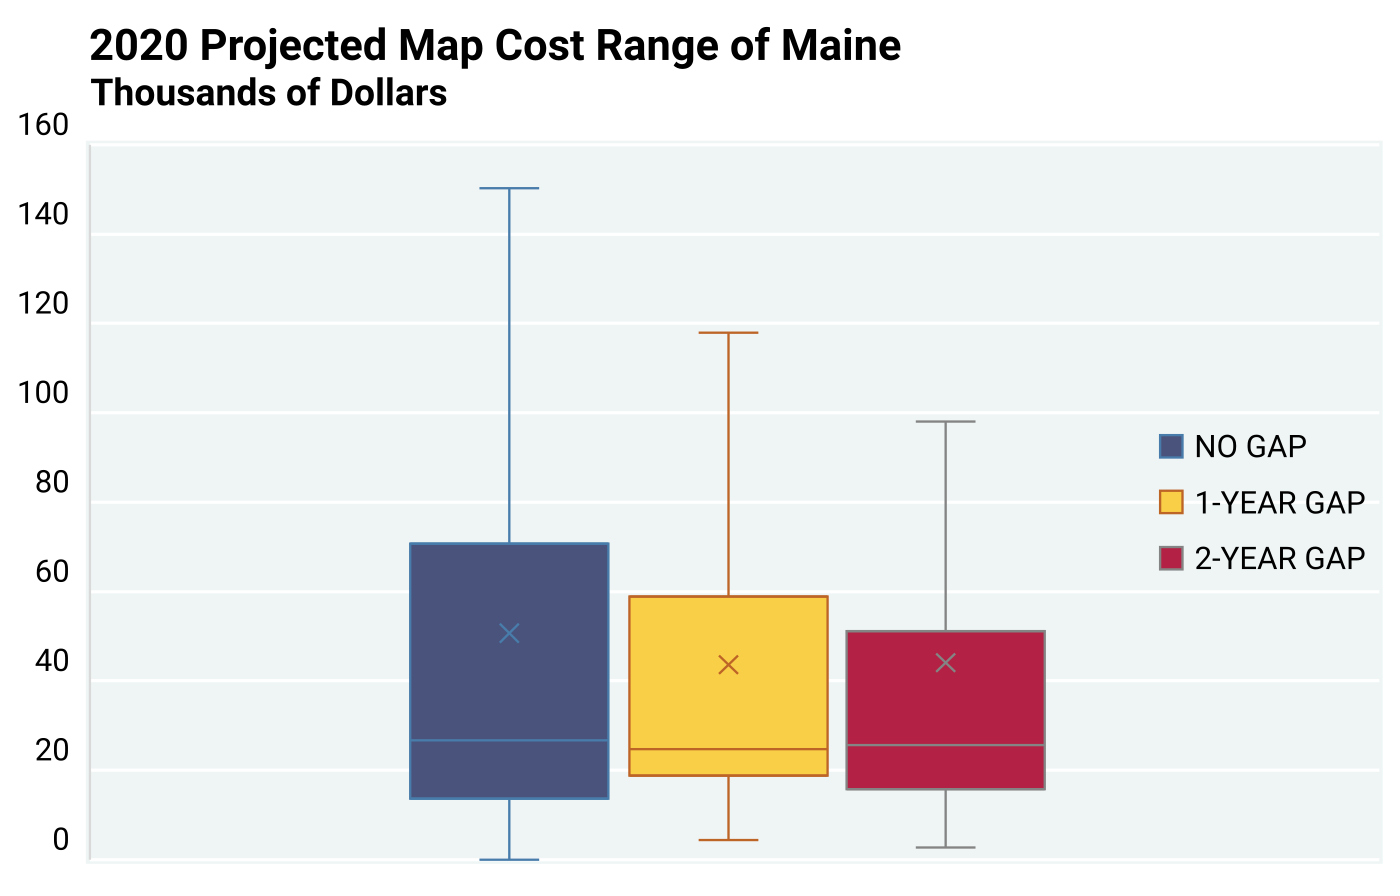
Figure A7.27
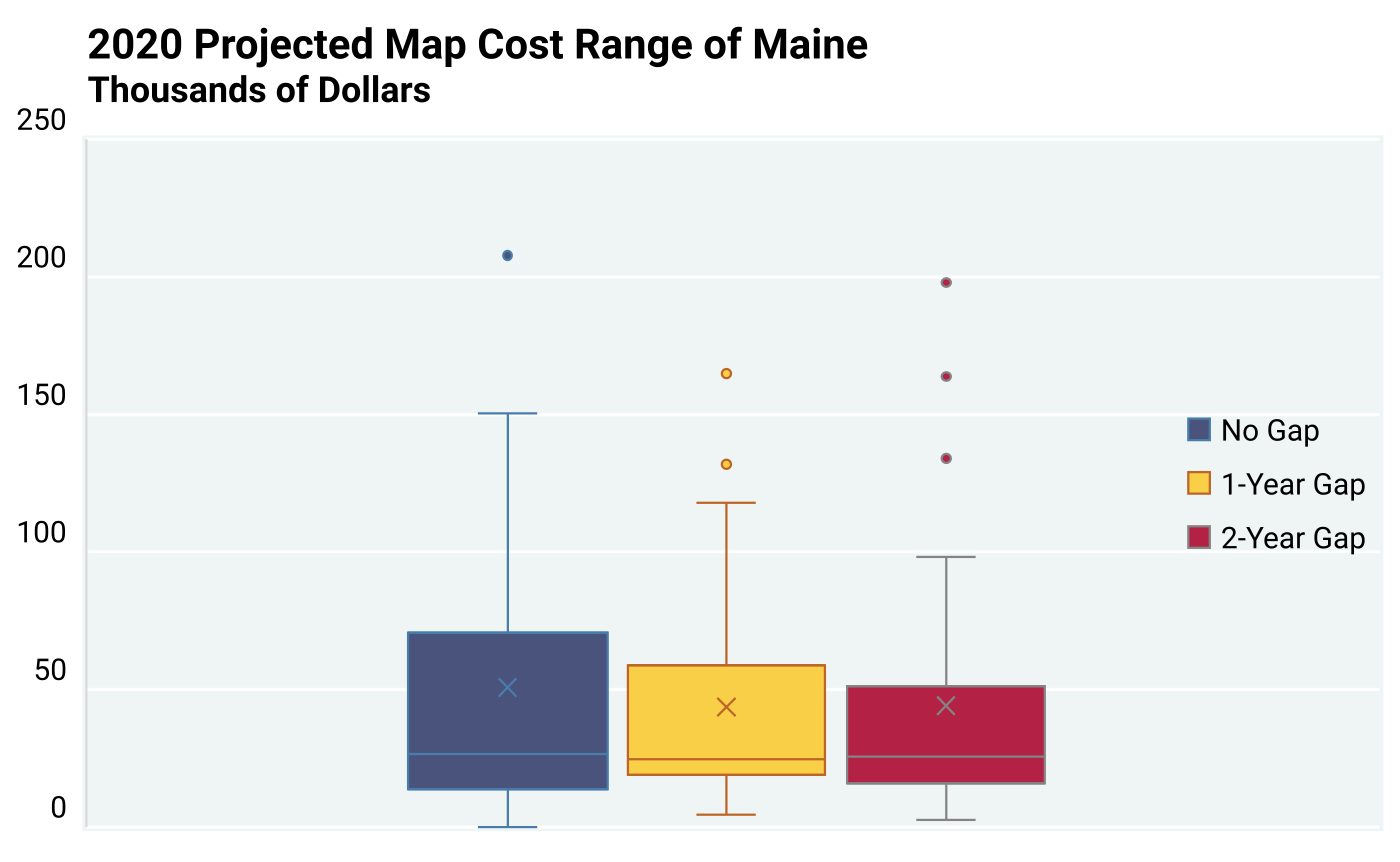
Figure A7.28
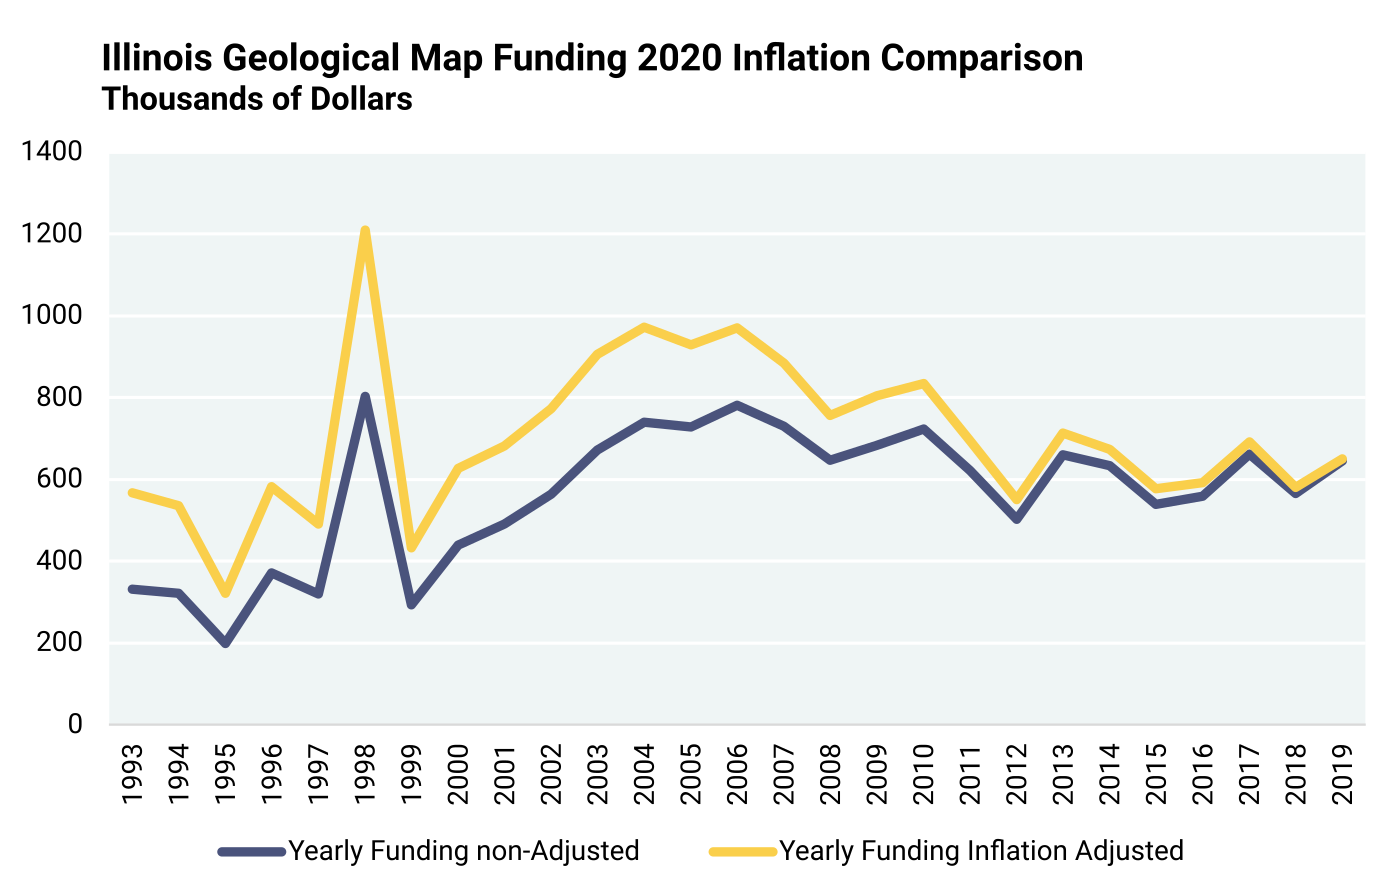
Figure A7.29
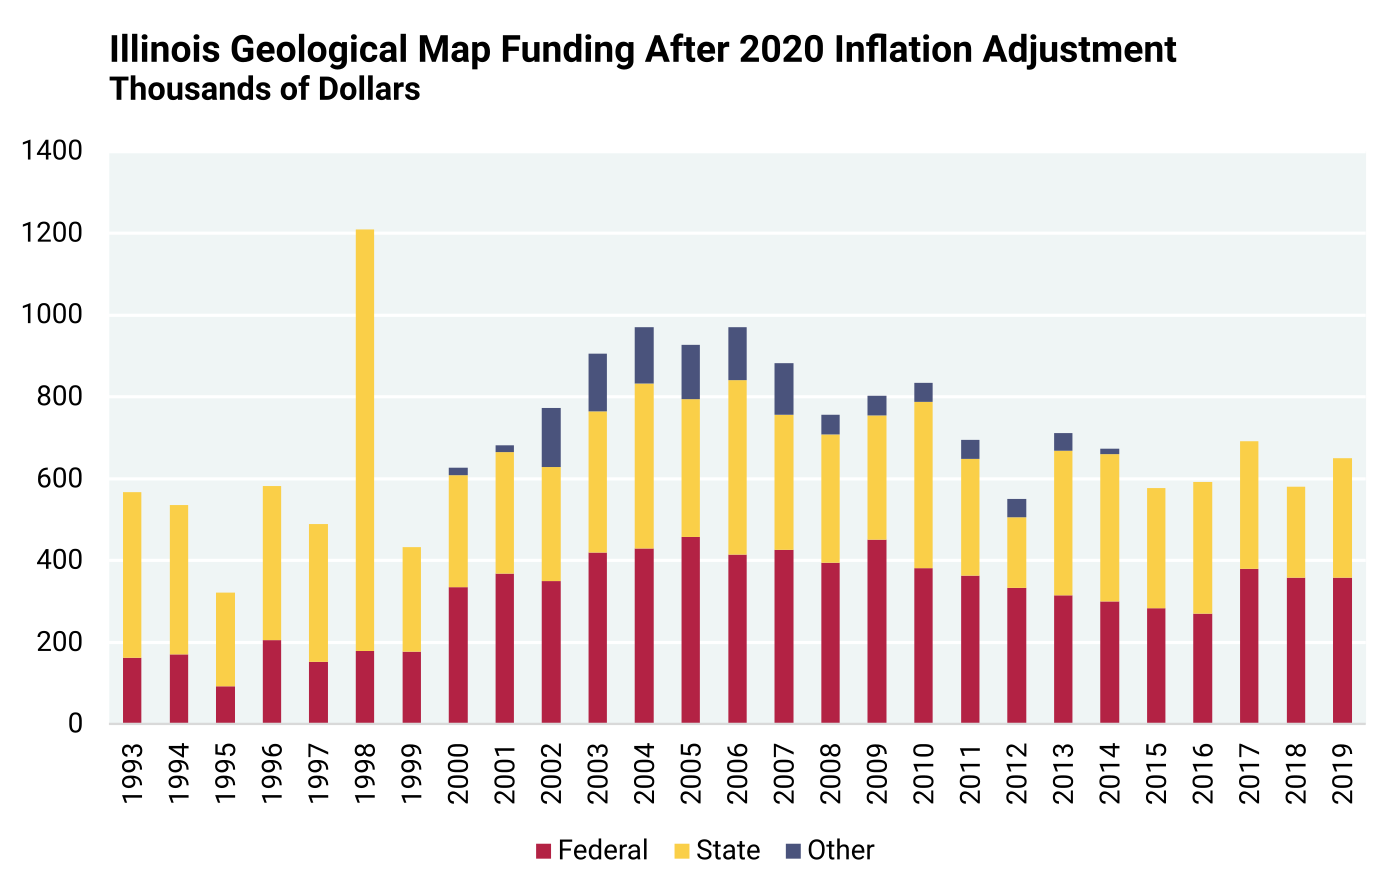
Figure A7.30
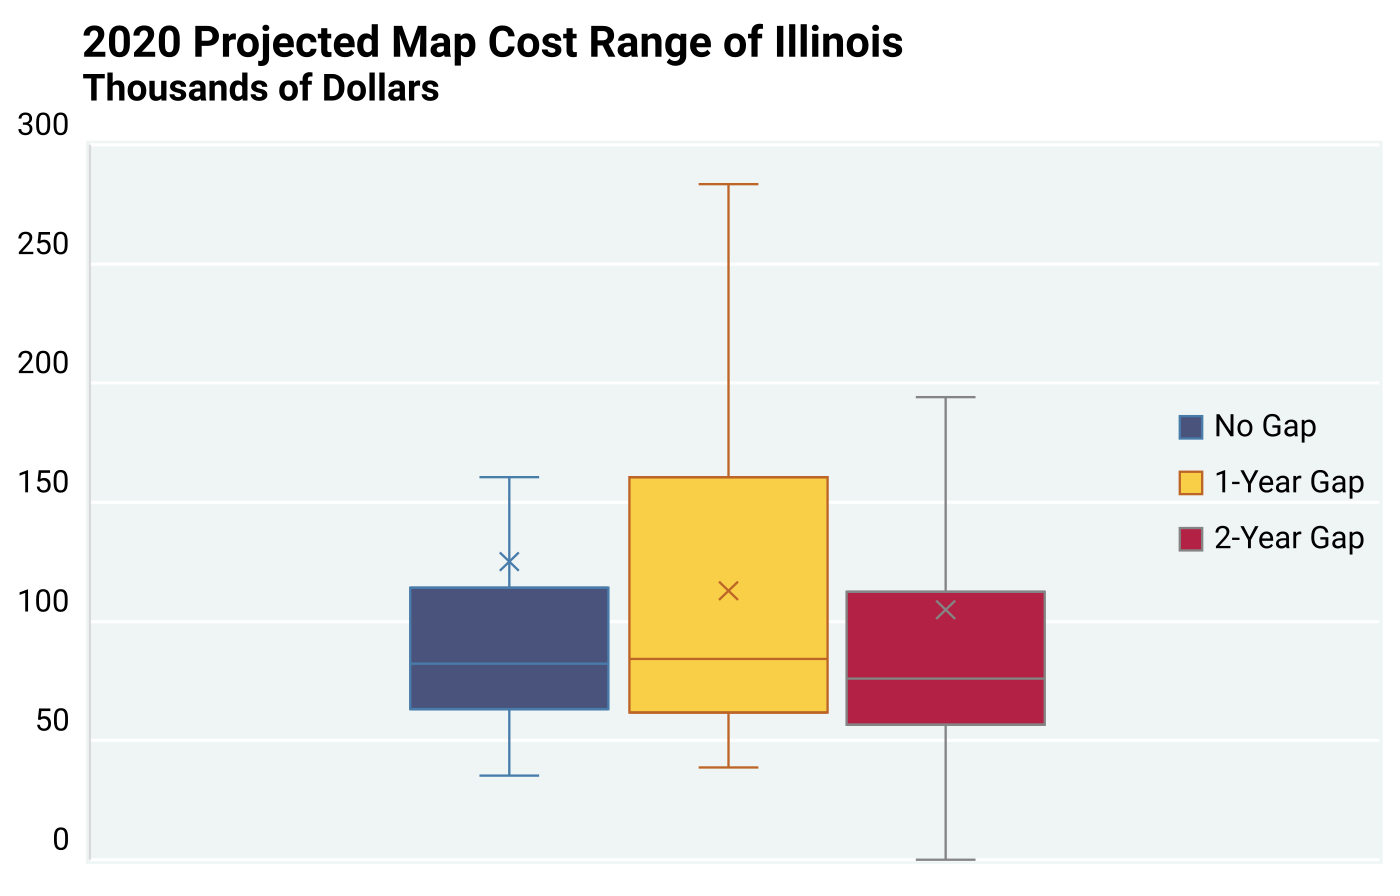
Figure A7.31
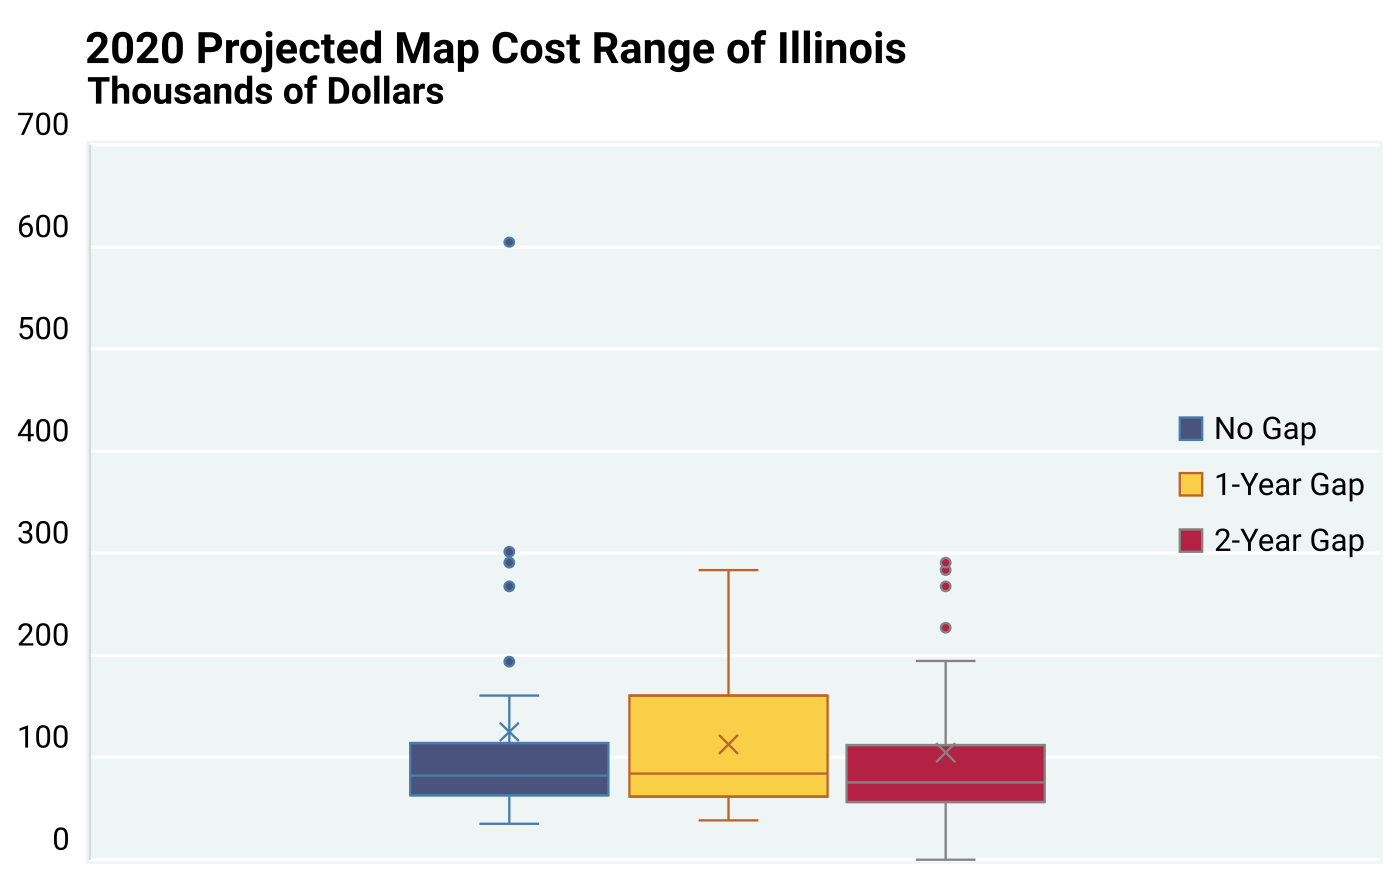
Figure A7.32
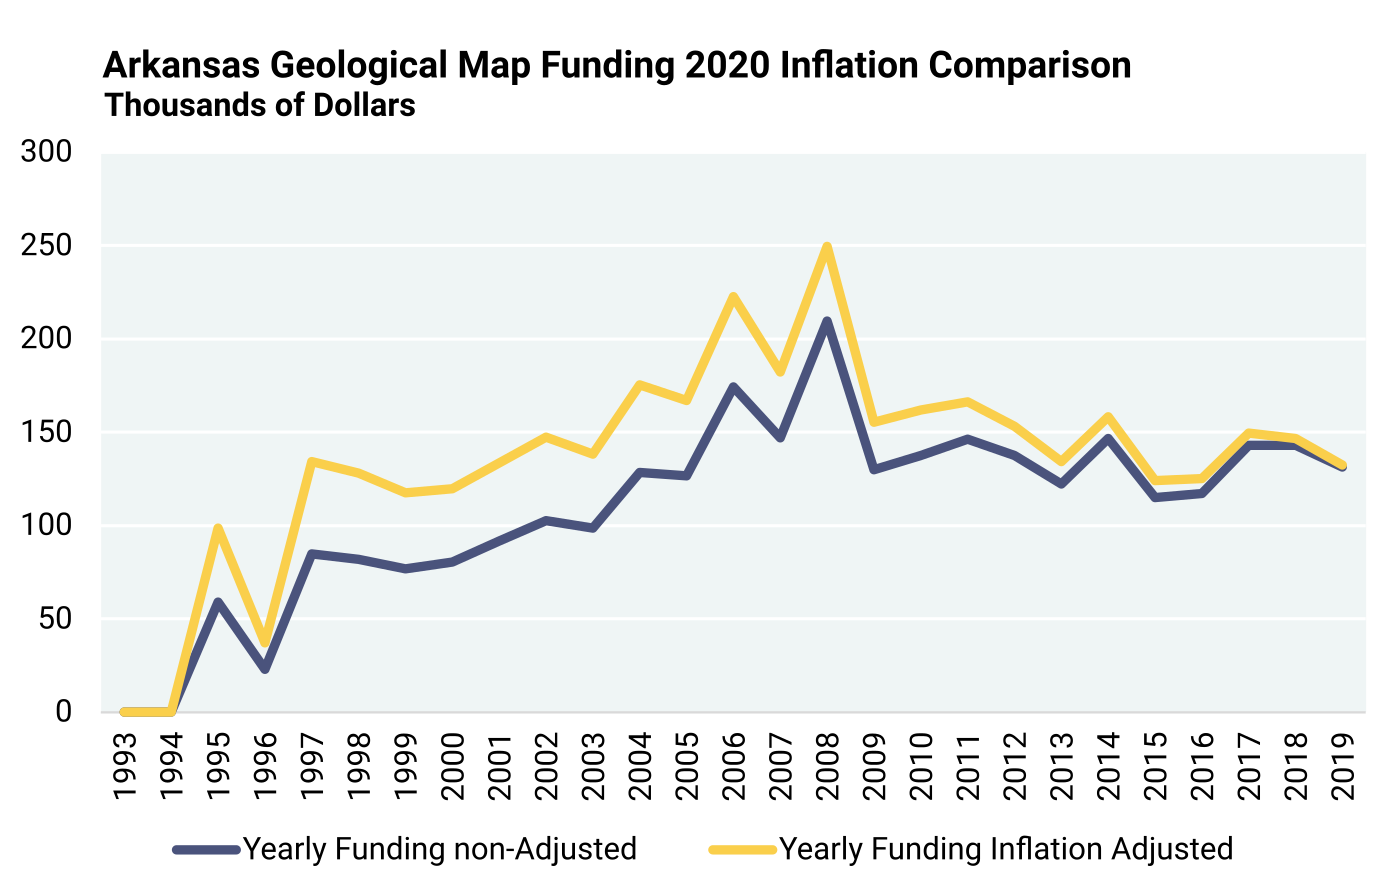
Figure A7.33
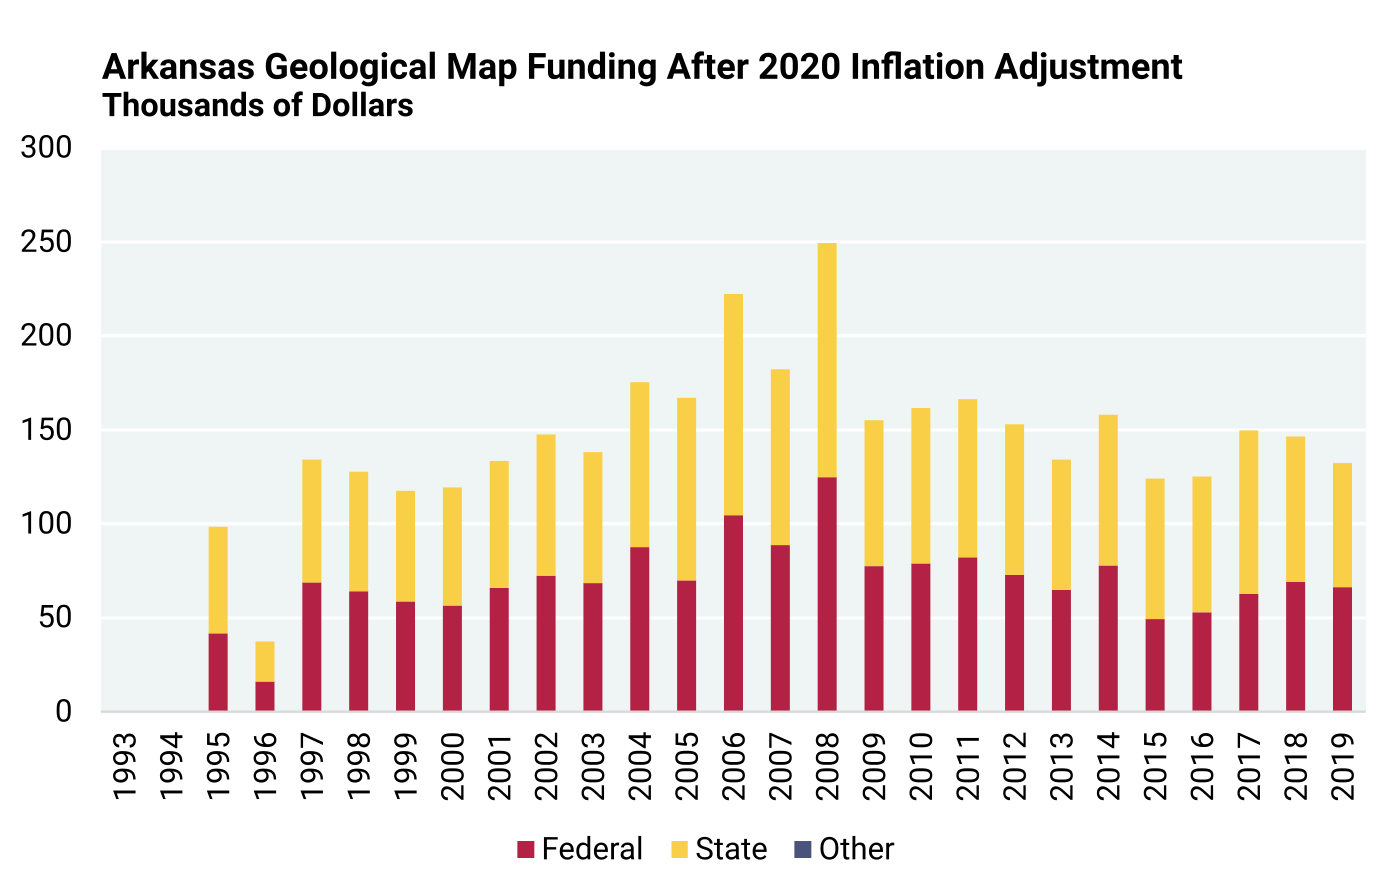
Figure A7.34
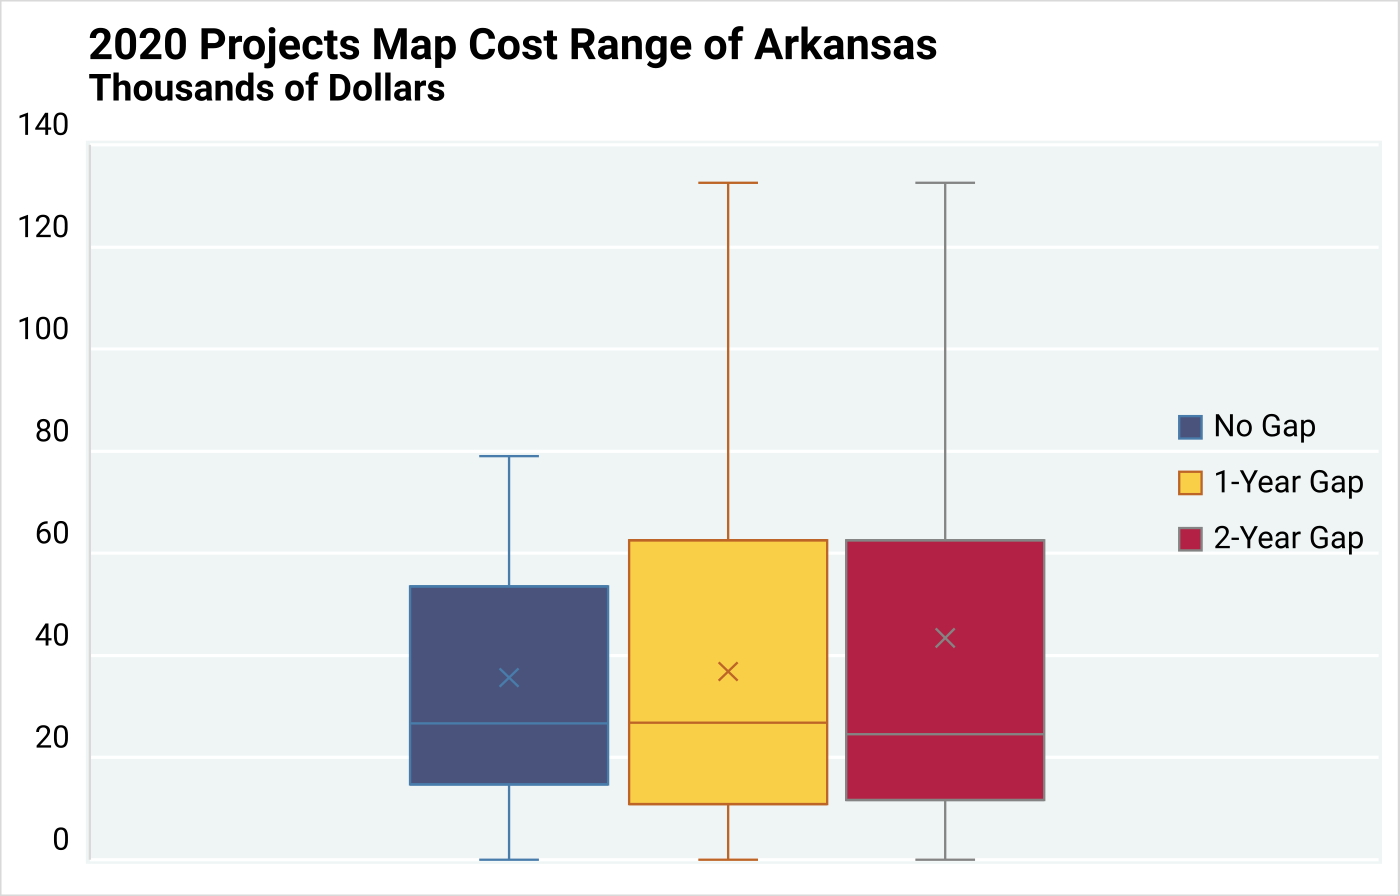
Figure A7.35
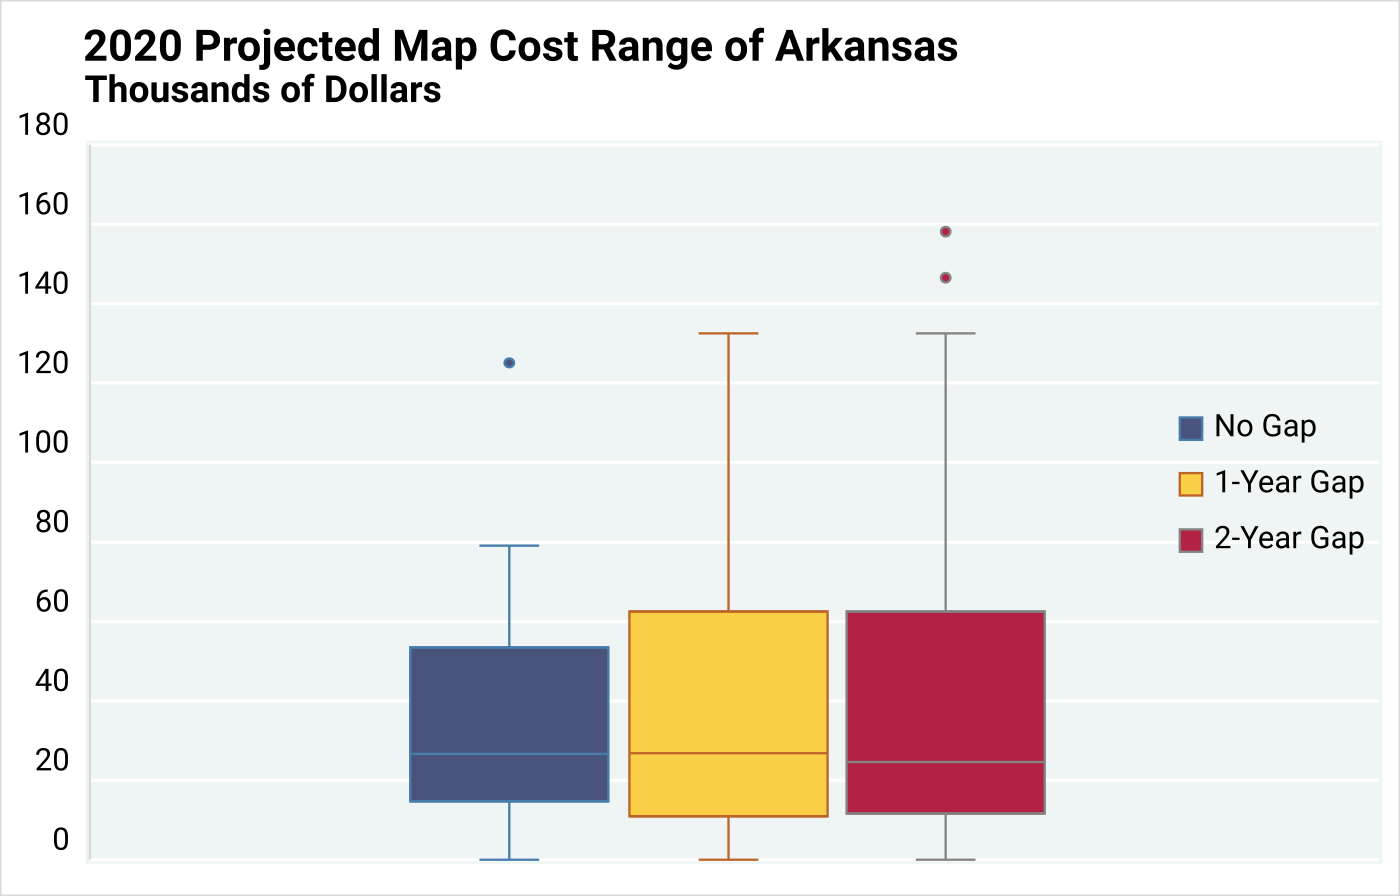
Figure A7.36
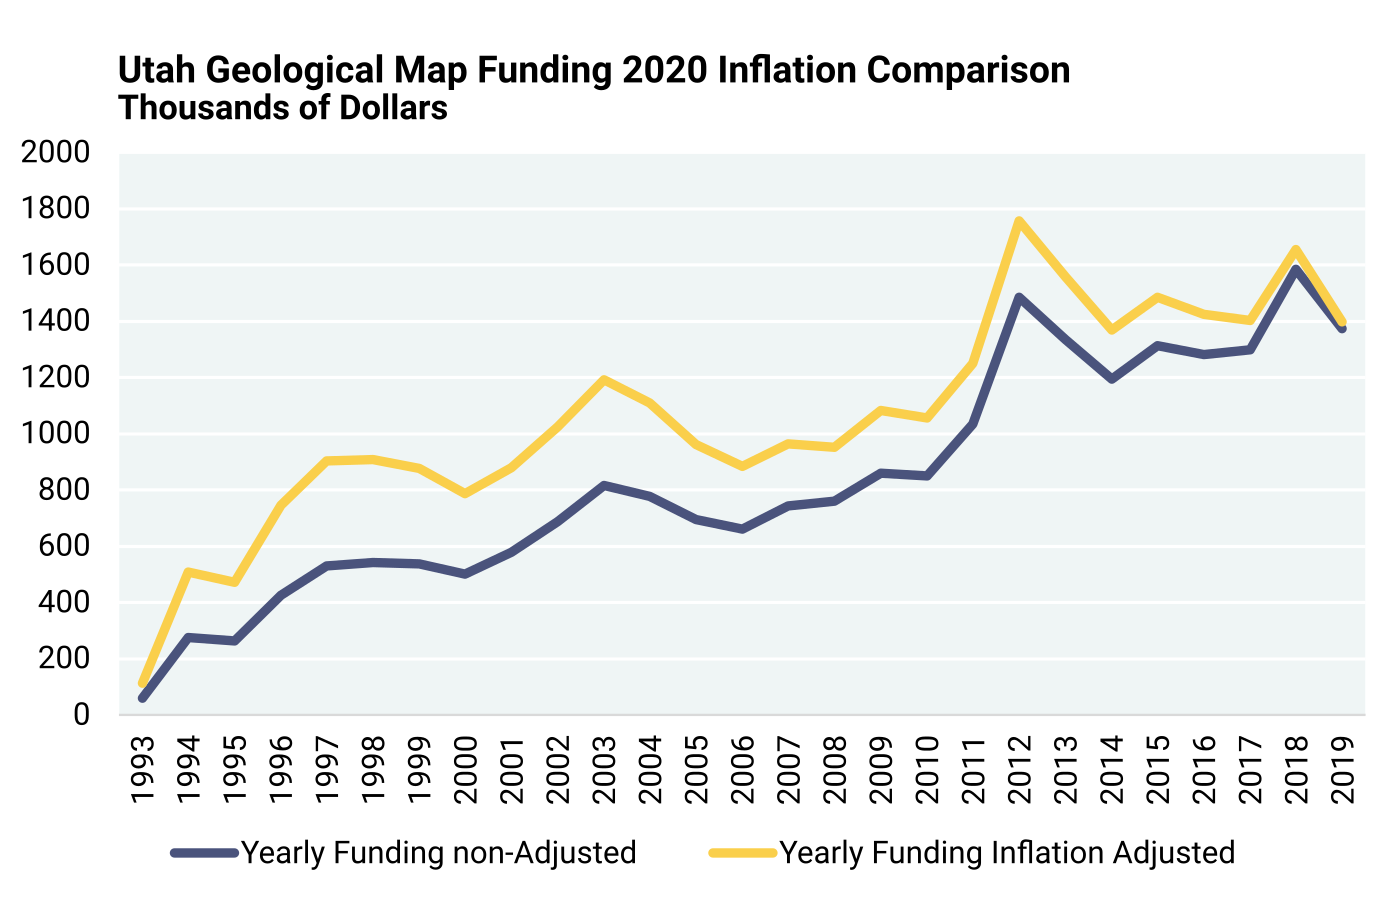
Figure A7.37
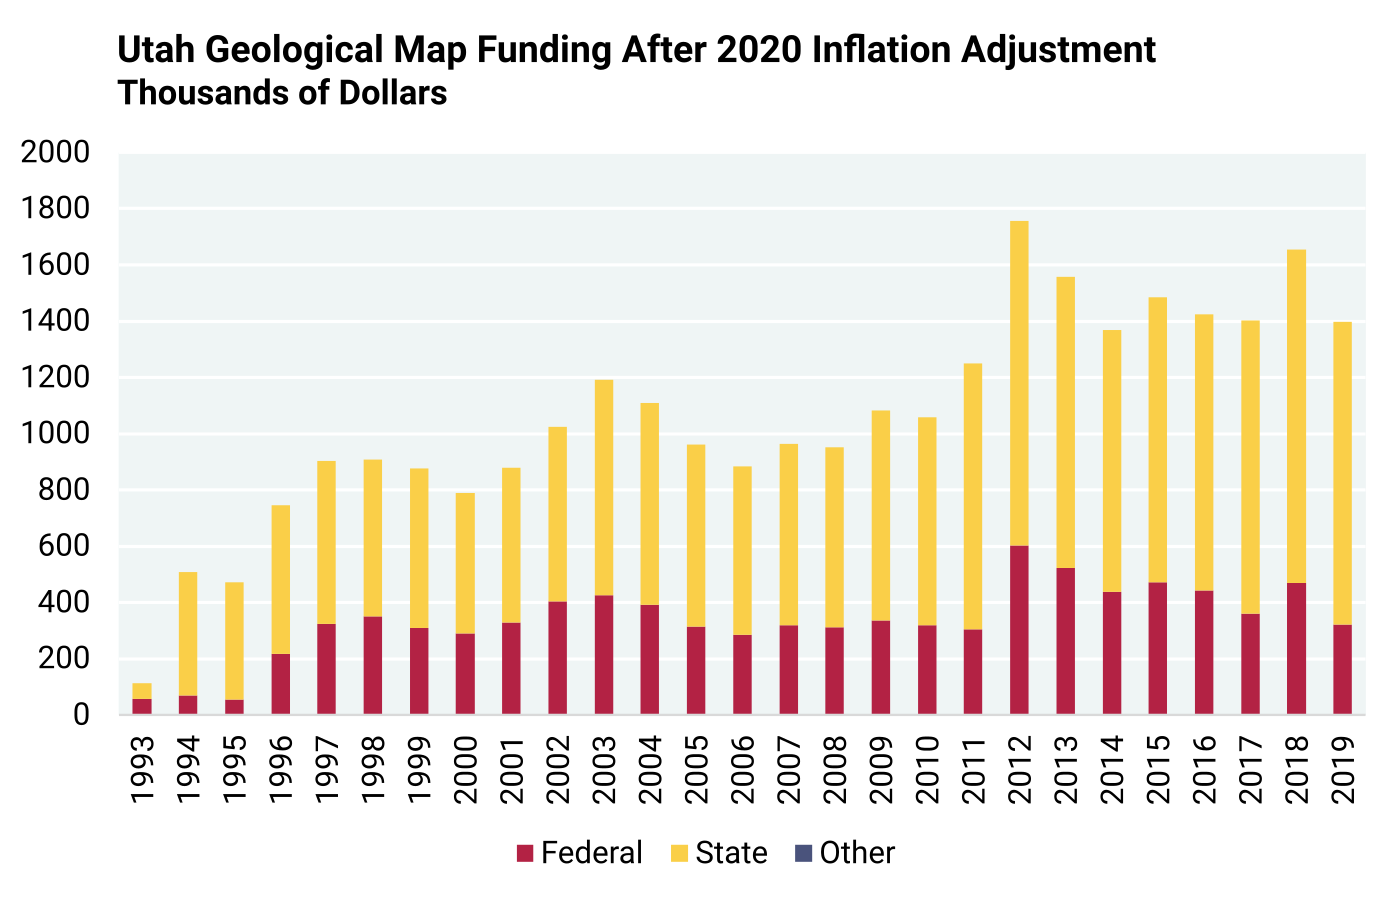
Figure A7.38
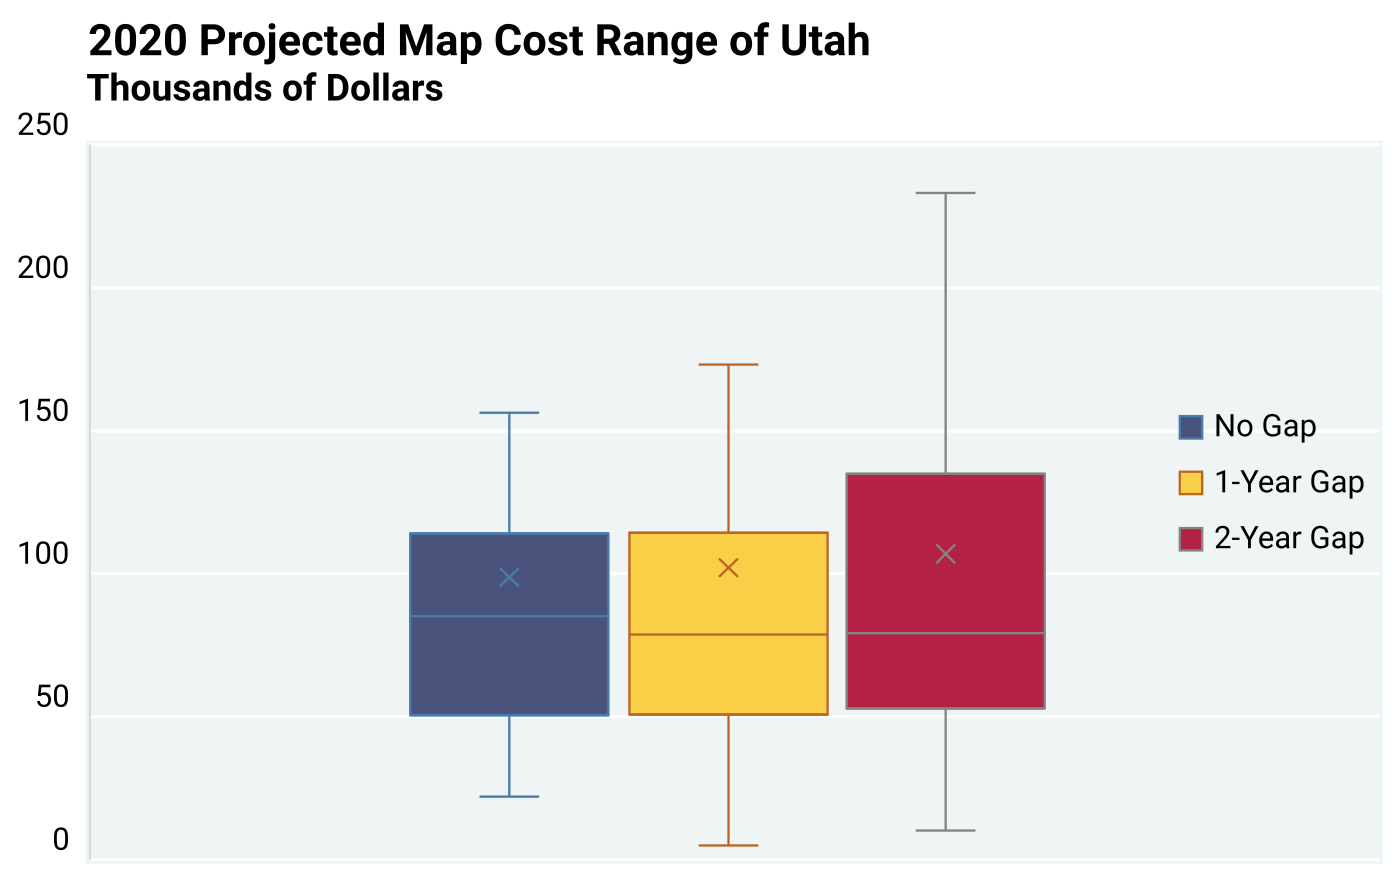
Figure A7.39
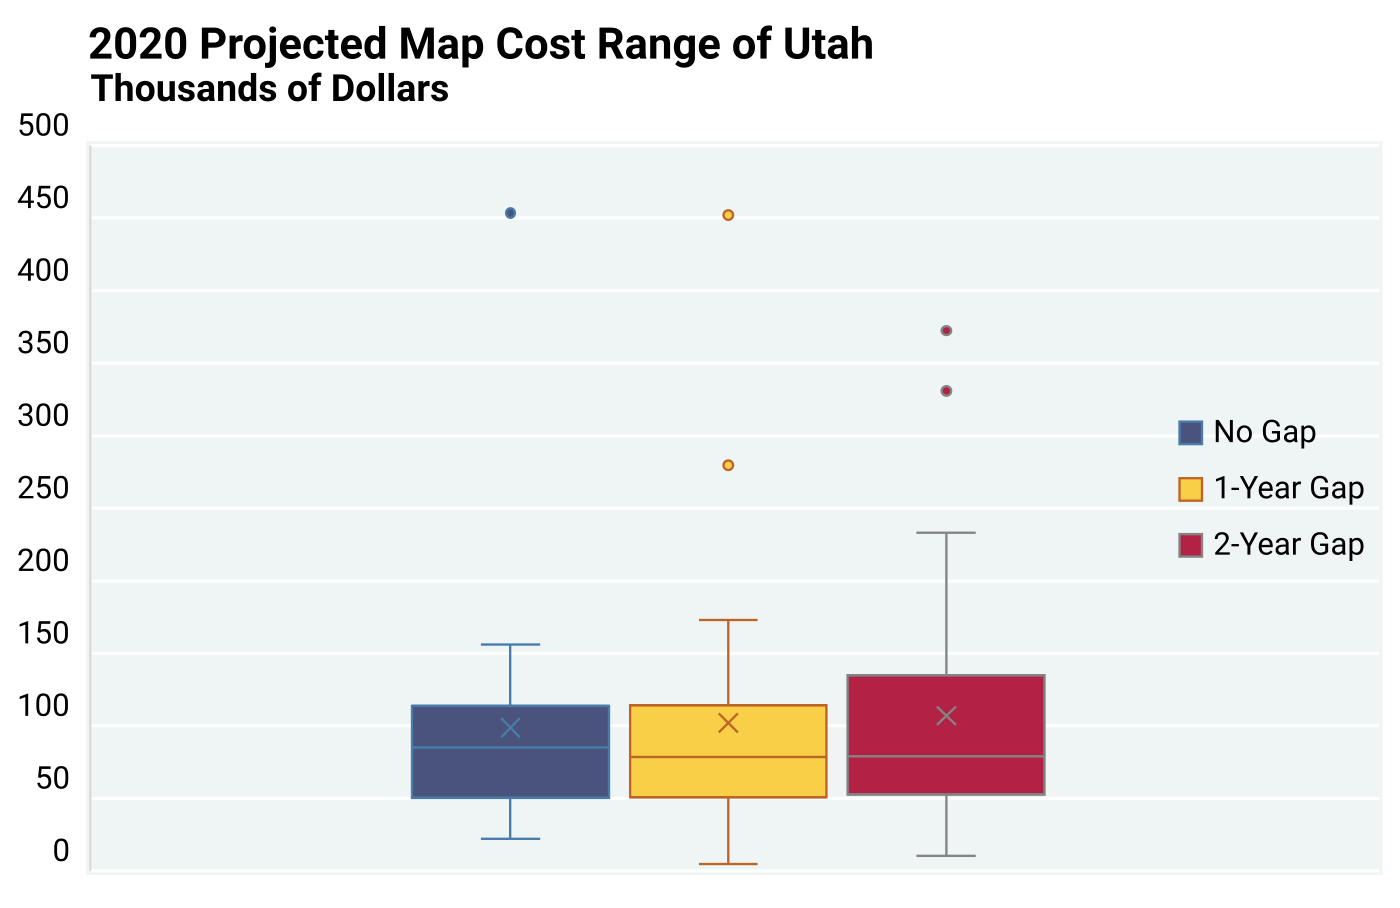
Figure A7.40
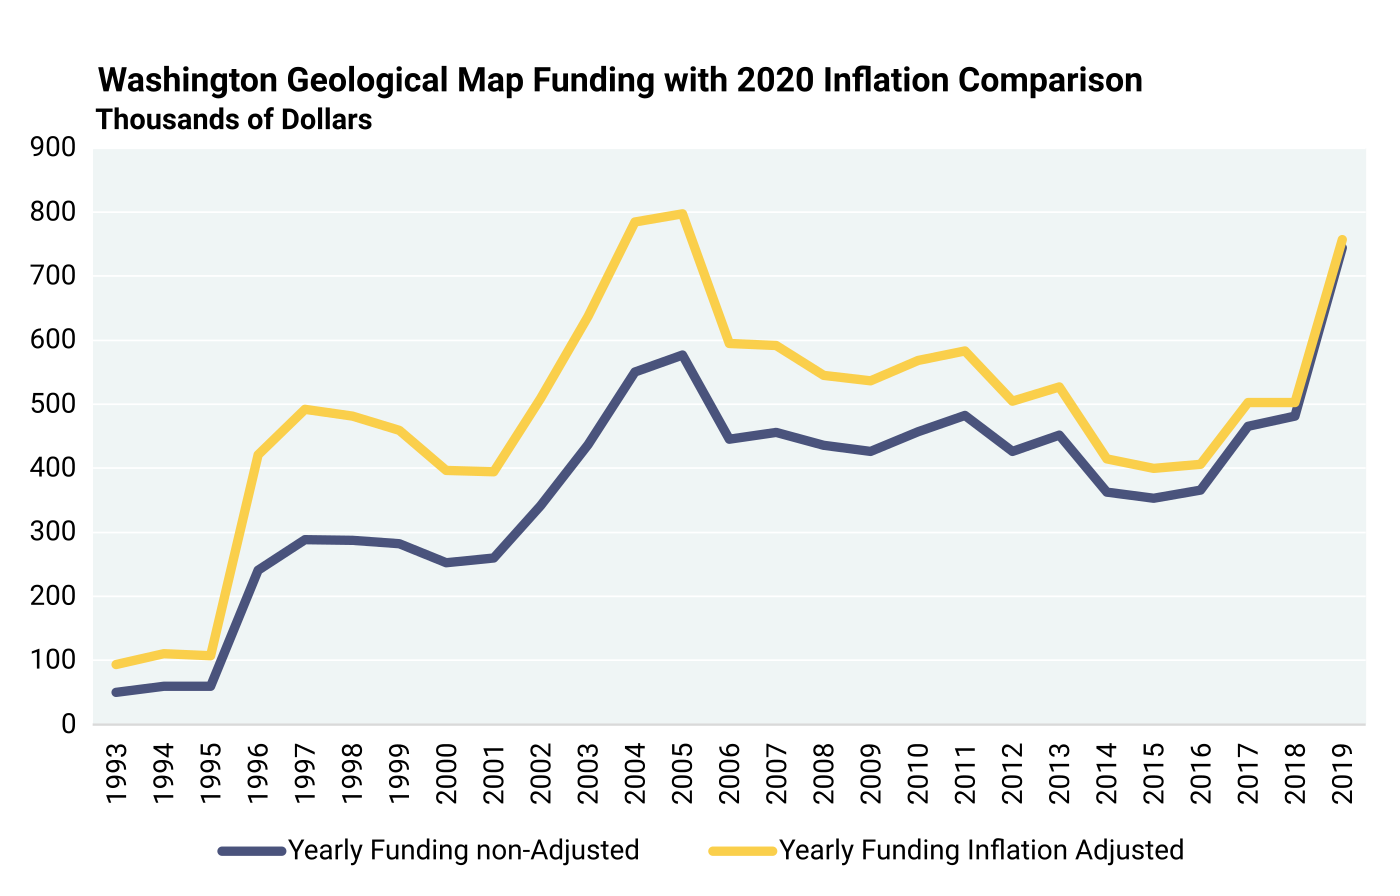
Figure A7.41
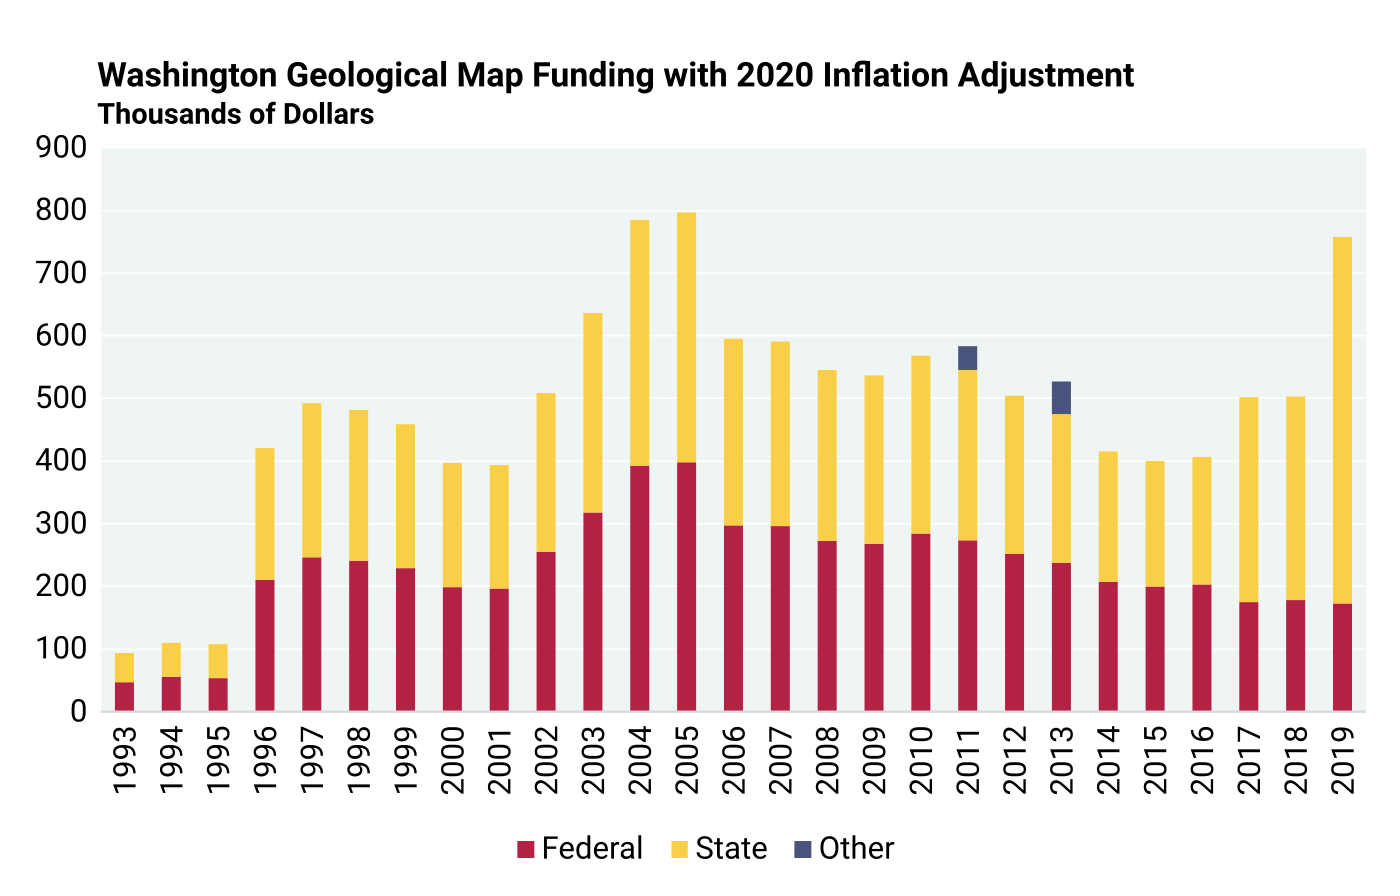
Figure A7.42
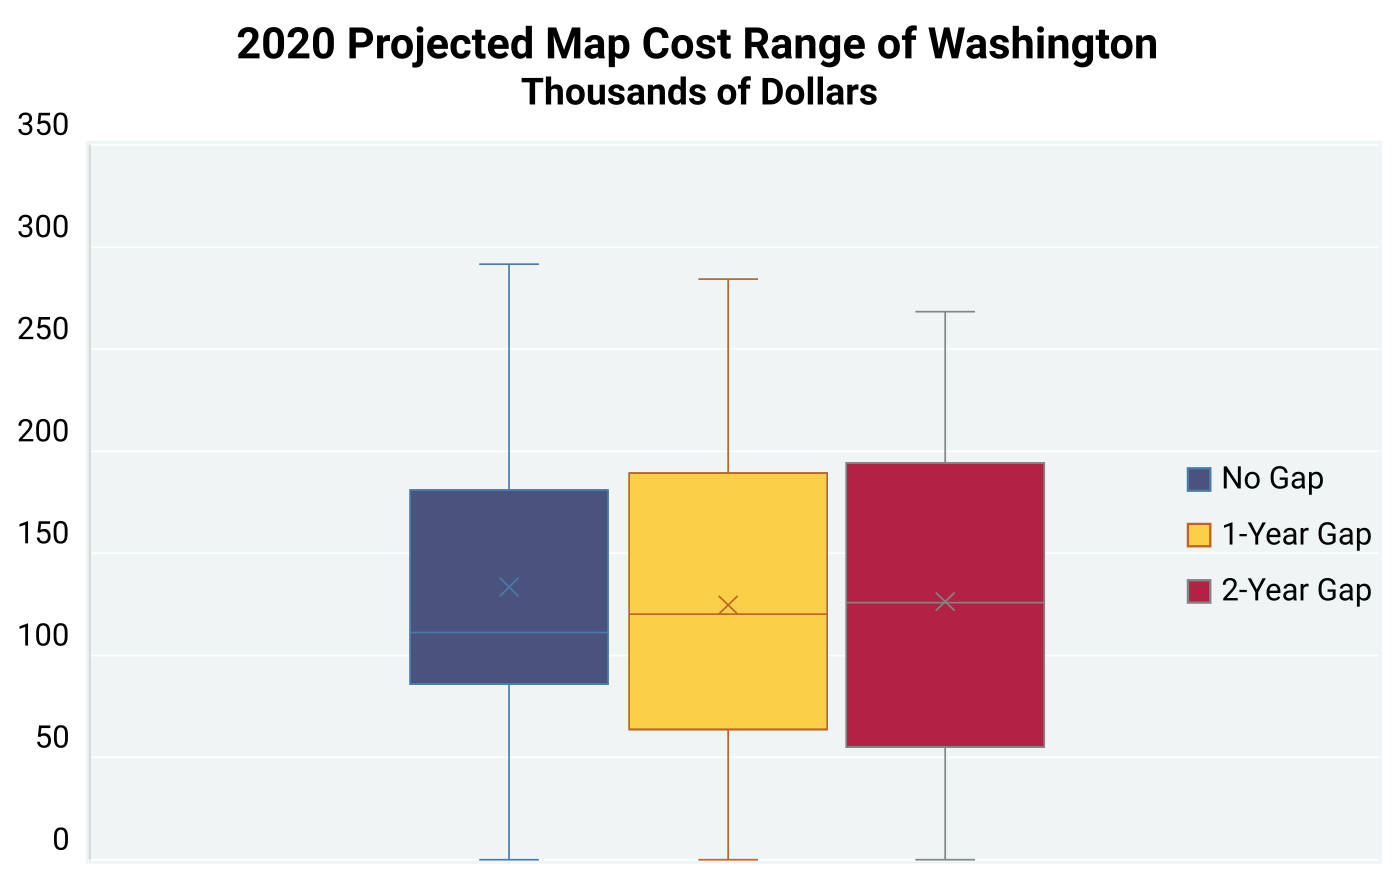
Figure A7.43
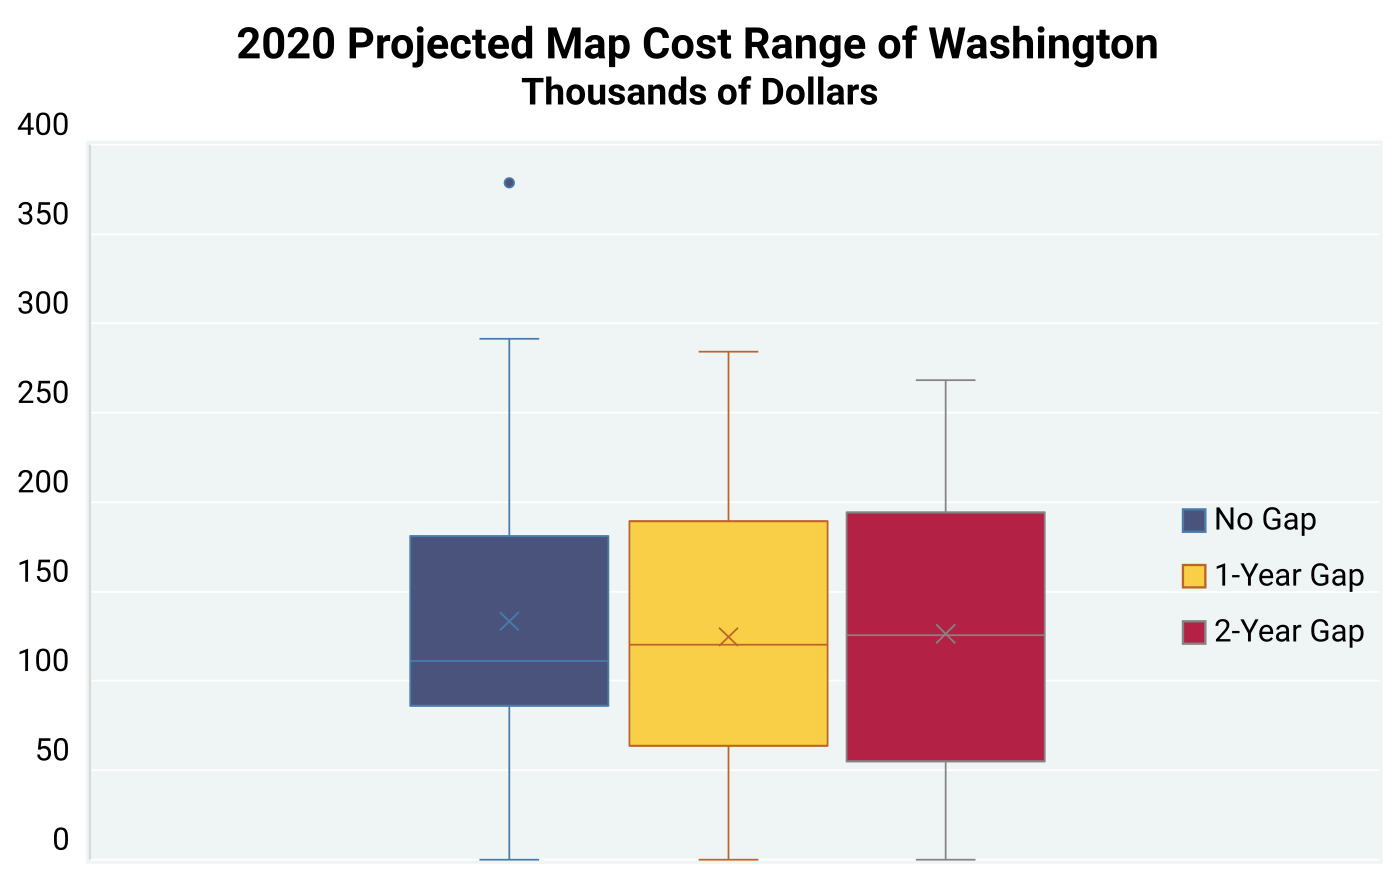
Table of Contents
- Abstract
- Acknowledgements
- Executive Summary
- Chapter 1: Introduction
- Chapter 2: Study Objectives and Methodology
- Chapter 3: Stakeholder Assessment of Map Producing Agencies
- Chapter 4: Cost for Geological Mapping
- Chapter 5: Geological Mapping Program Activities — Critical Components
- Chapter 6: Benefits of Geological Mapping: Quantitative Assessment of Responses to Stakeholder Questionnaire
- Chapter 7: Geological Map Demand and Economic Estimates of Costs and Benefits
- Chapter 8: Regional Variations in Costs and Benefits of Geological Mapping
- Chapter 9: Quantitative Value Assessment from Independent EPA Data
- Chapter 10: Qualitative Assessment of Value of Geological Maps by Stakeholders
- Chapter 11: An Economic Model of General Geological Mapping Applications
- Chapter 12: Stakeholder Input about Future Geological Mapping
- Chapter 13: Lessons Learned and Suggestions for Future Analyses
- Chapter 14: Summary and Conclusions
- Appendix 1: Cost Sheet Template
- Appendix 2: Questionnaire to Stakeholders
- Appendix 3: Example Solication Letter Requesting Stakeholders to Participate in National Cost-Benefit Assessment
- Appendix 4: Summary Statistics, Outliers, and Confidence Intervals
- Appendix 5: Annual State Geological Survey Map Views
- Appendix 6: Regional Cost-Benefit Analysis Datasets
- Appendix 6a: Questionnaire Data Schema
- Appendix 6b: State Geological Survey Reporting Schema
- Appendix 7: Chapter 8 Supplemental Figures and Tables
