Chapter 3: Stakeholder Assessment of Map Producing Agencies
Abstract
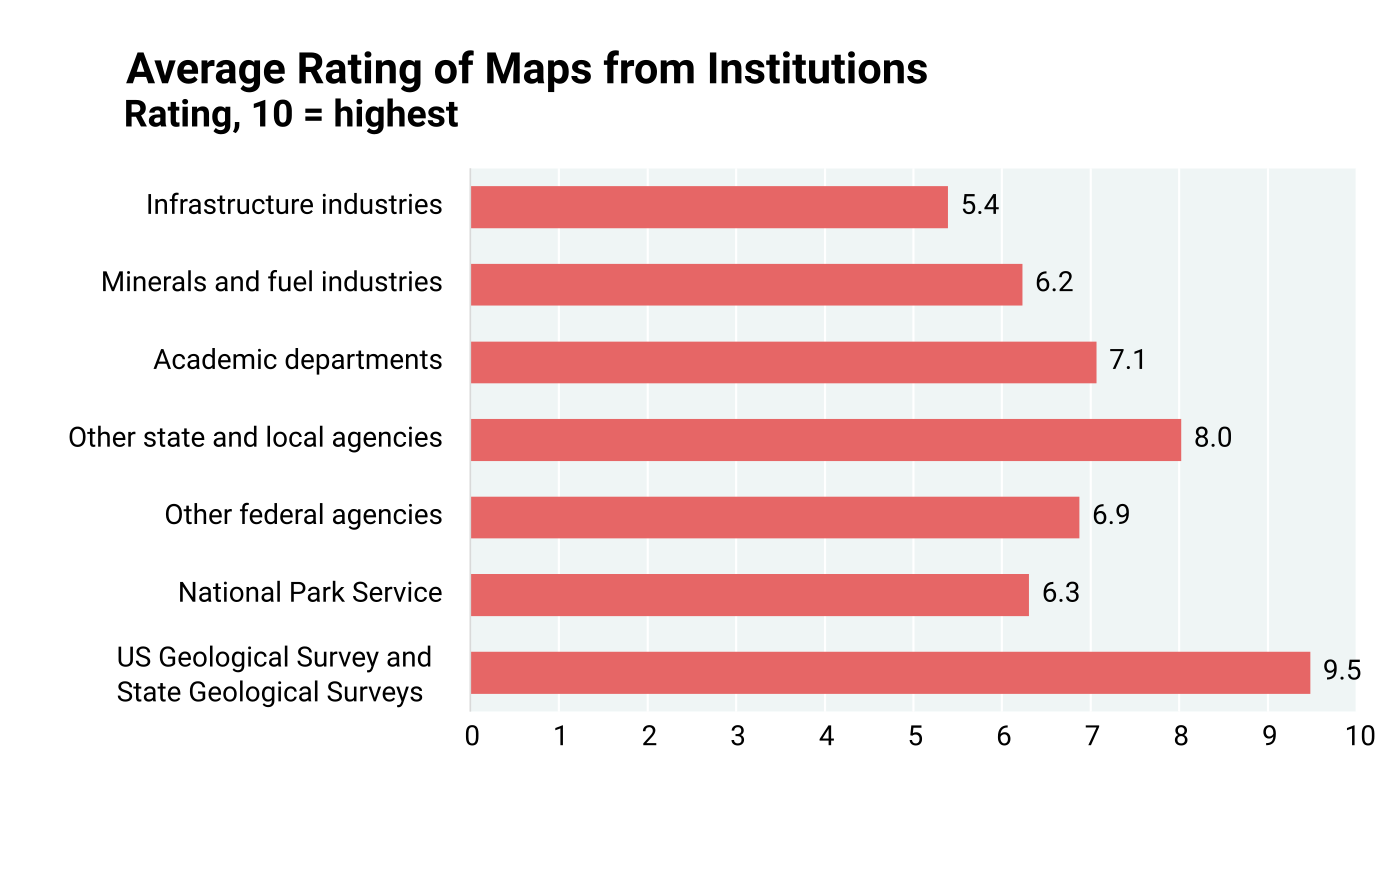
Stakeholder valuation of geological maps may be influenced by their trust in the map making agencies. Geological maps produced by State Geological Surveys (SGS) and the U.S. Geological Survey (USGS) are considered the gold standard, with ratings for such maps averaging 9.5/10 as opposed to other sources with a 6.7/10 rating. Another good indicator of stakeholder views was how often and for what purpose they visit map producing agencies, what products they use, and how satisfied they are with the visits, whether in person or online. More than 70% of respondents to the questionnaire reported visiting SGS or USGS offices or web sites at least several times per year, and 80% of them implied that additional money would have to be spent on their projects if geological maps were not available from SGS or the USGS. Questions directed at stakeholders to that end indicated a high regard for the scientific capabilities and the independence (i.e., unbiased products) of SGS and the USGS.
3.1: Results and Discussion
In addition to assessing the perceived value of geological maps (see Chapters 6 and 8), the questionnaire also included queries that addressed the reputations of the map-producing agencies themselves. Geological maps, as well as reports and other data, are generated by several organizations and agencies, each with a special focus and based on the technical and economic capabilities of those producing the products. Respondents provided input about their preferences for products from these organizations (question 18). The overall averages of the ratings for each organization and agency (Figure 3.1.1) indicate that geological products generated by State Geological Surveys (SGS) and the U.S. Geological Survey (USGS) are rated the highest and are clearly considered the gold standard for geological maps. Ratings of geological maps produced by SGS and the USGS averaged 9.5/10. The mean rating assigned to all other entities was 6.7/10. It makes sense that geological maps produced by SGS and the USGS would have the highest confidence level for procurement by stakeholders. They perform considerably more geological mapping than other agencies, academia, and private industry. It is part of their core mission to do so, and their products are open access, designed to be publicly available, and have unbiased interpretations
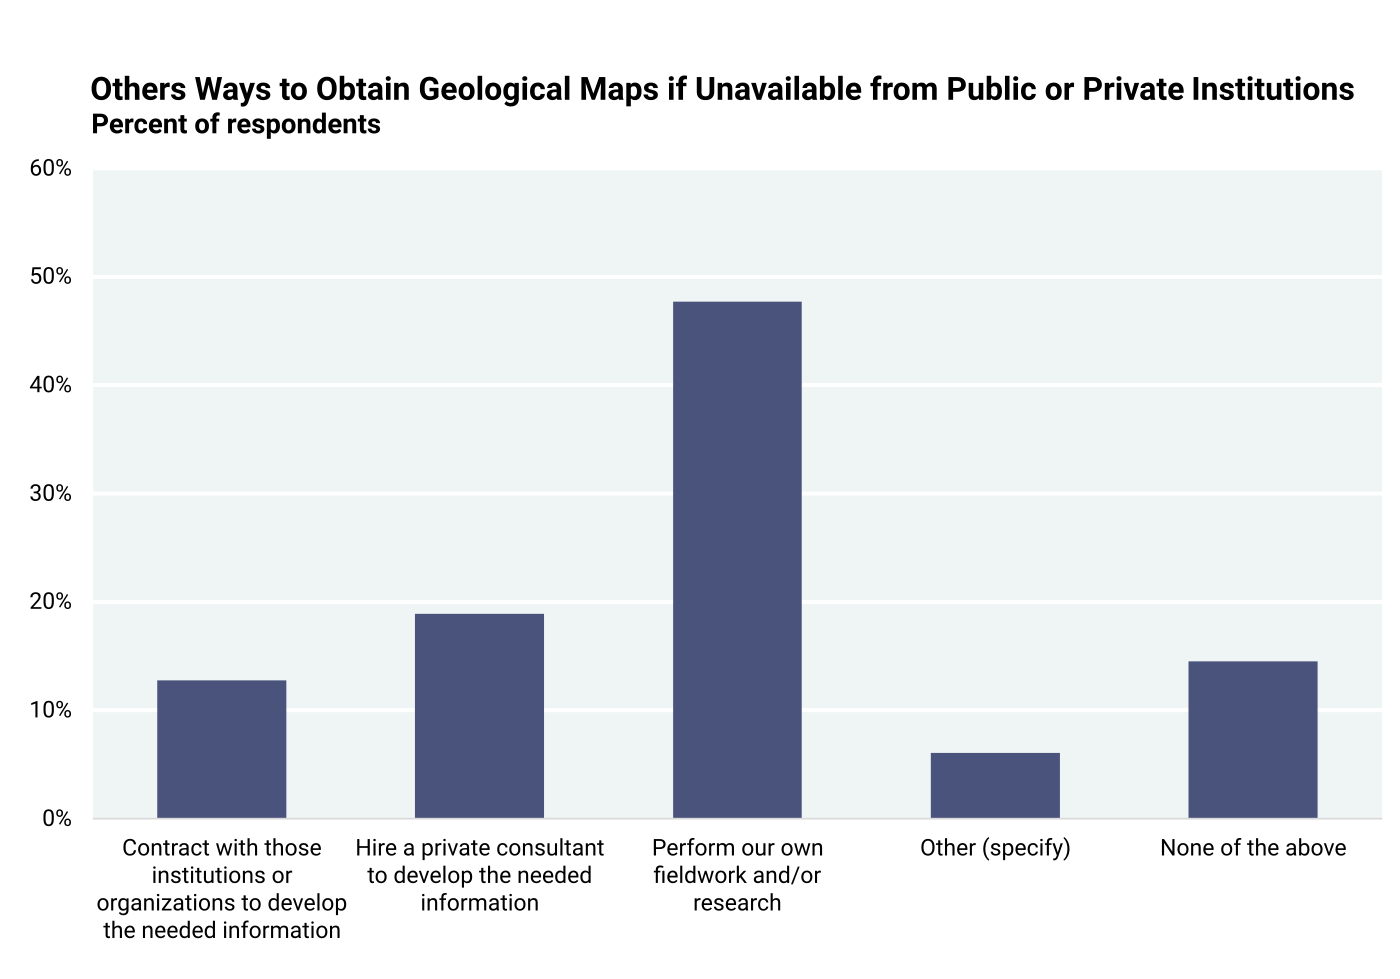
The importance to the respondents of public entities producing geological maps is further elaborated by answers on how they would acquire maps if not available (question 16). About 12.8% of respondents would contract with state agencies and pay for it. However, about 47.7% preferred to do their own mapping, and about 18.6% would hire outside consultants to do the mapping. Affordability was also an important consideration in these responses. Notably, about 14.5% would do without geological maps if they were not available from state or federal agencies (Figure 3.1.2). As briefly discussed earlier and covered in more detail in Chapter 9, such a decision may have negative consequences, such as reducing the quality of work or causing adverse environmental impacts. Looking at Figure 3.1.2 another way, about 80% of stakeholders implied that additional money would have to be spent for the required geological information if maps were not available from SGS and the USGS. This is discussed in detail in Chapter 6 (Table 6.5.1.), whereby stakeholders provided values of project cost increases and willingness to pay if maps were not available, the long-term value of a map, and expected payment for a map.
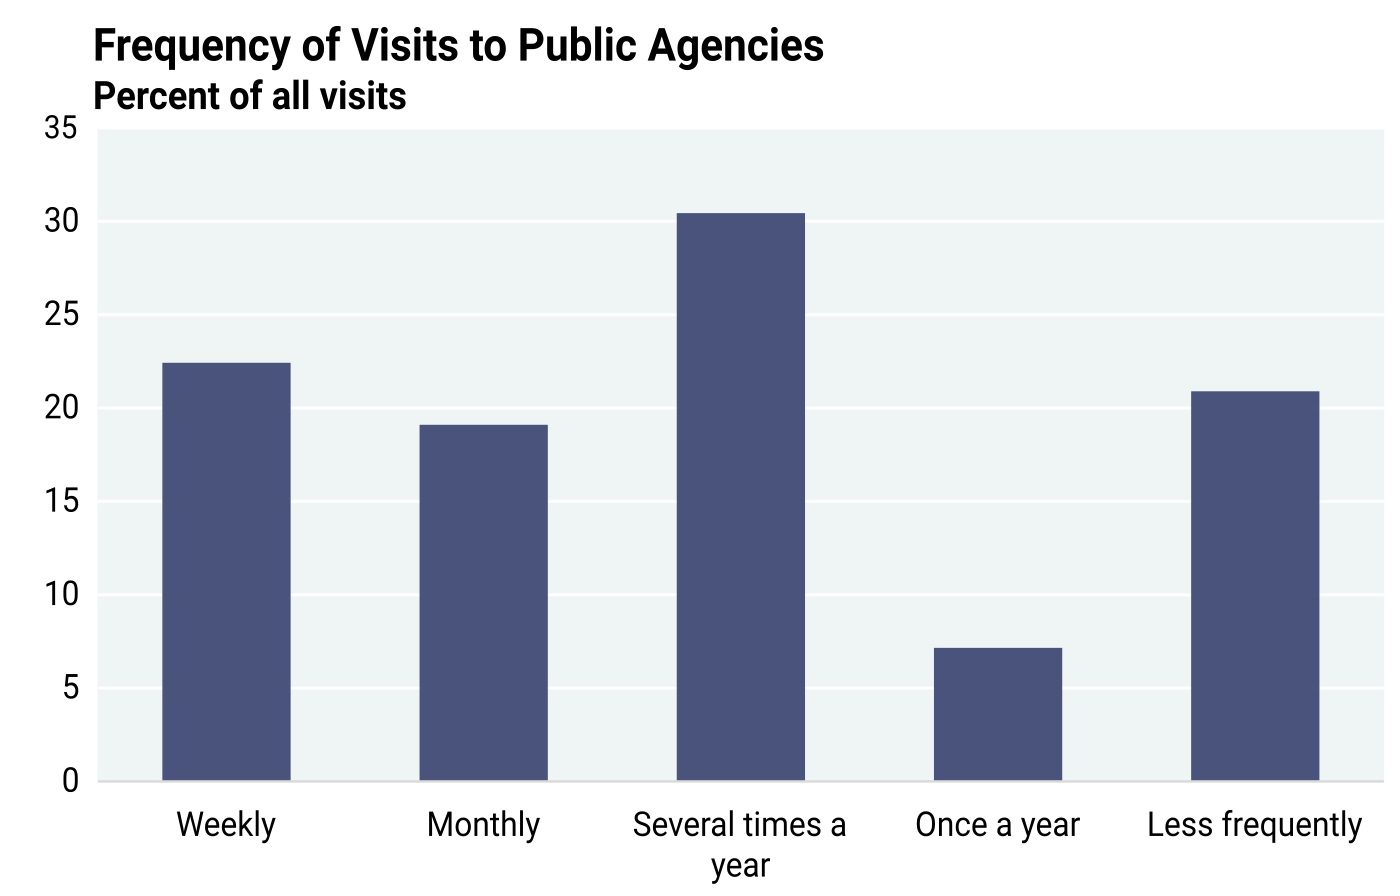
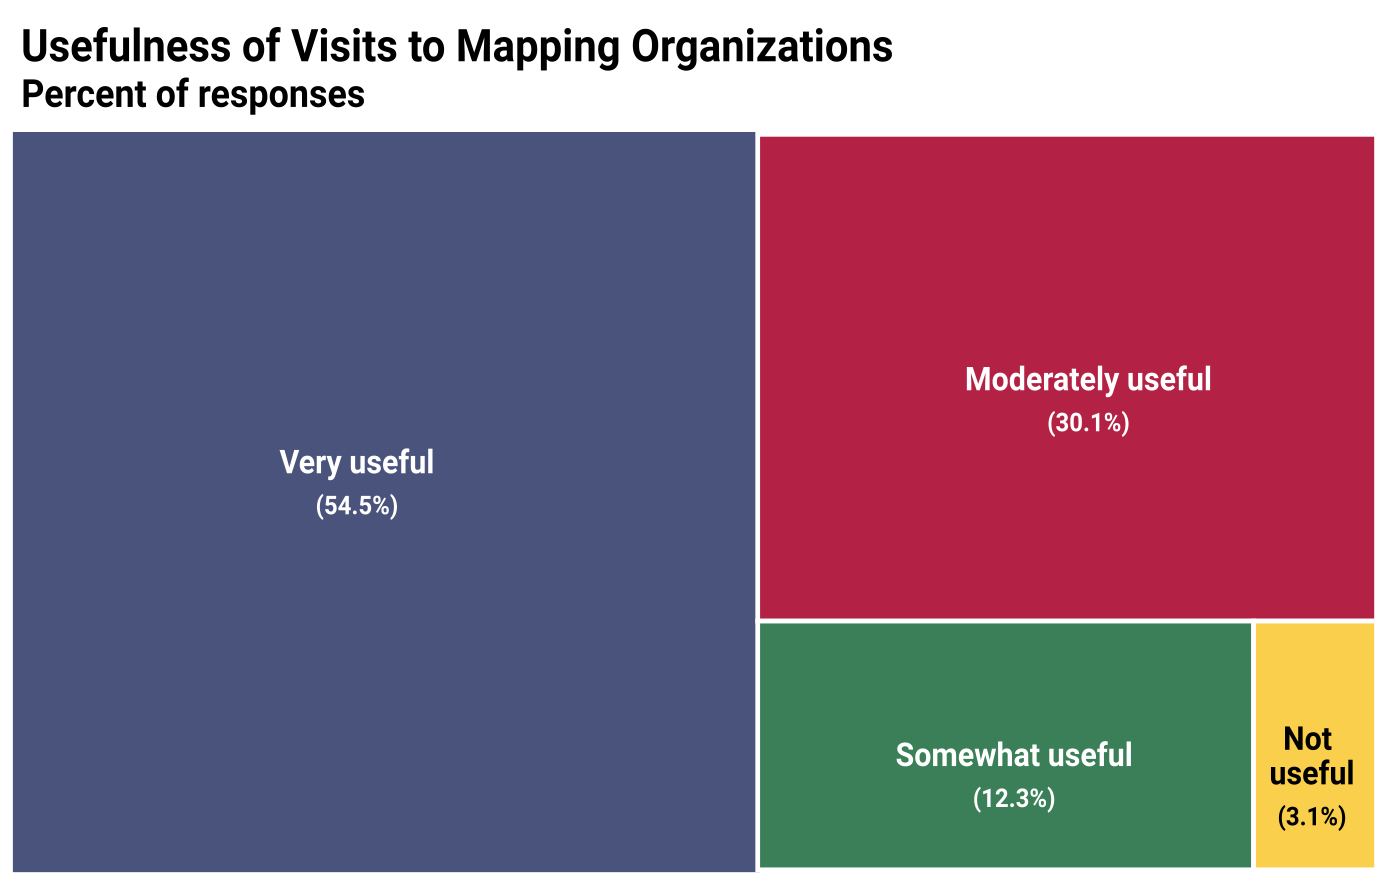
Another indicator of how respondents viewed map producing agencies is the frequency with which they visit these agencies. Visits to offices, facilities, or web sites of agencies that produce geological maps appear popular (question 13), with over 70% visiting SGS and/or the USGS at least several times per year (Figure 3.1.3). Specific reasons for personal visits were not solicited. However, 54.5% of respondents found visits to offices, facilities, or web sites “very useful” and 30% “moderately useful” (question 14). (Figure 3.1.4).


Table of Contents
- Abstract
- Acknowledgements
- Executive Summary
- Chapter 1: Introduction
- Chapter 2: Study Objectives and Methodology
- Chapter 3: Stakeholder Assessment of Map Producing Agencies
- Chapter 4: Cost for Geological Mapping
- Chapter 5: Geological Mapping Program Activities — Critical Components
- Chapter 6: Benefits of Geological Mapping: Quantitative Assessment of Responses to Stakeholder Questionnaire
- Chapter 7: Geological Map Demand and Economic Estimates of Costs and Benefits
- Chapter 8: Regional Variations in Costs and Benefits of Geological Mapping
- Chapter 9: Quantitative Value Assessment from Independent EPA Data
- Chapter 10: Qualitative Assessment of Value of Geological Maps by Stakeholders
- Chapter 11: An Economic Model of General Geological Mapping Applications
- Chapter 12: Stakeholder Input about Future Geological Mapping
- Chapter 13: Lessons Learned and Suggestions for Future Analyses
- Chapter 14: Summary and Conclusions
- Appendix 1: Cost Sheet Template
- Appendix 2: Questionnaire to Stakeholders
- Appendix 3: Example Solication Letter Requesting Stakeholders to Participate in National Cost-Benefit Assessment
- Appendix 4: Summary Statistics, Outliers, and Confidence Intervals
- Appendix 5: Annual State Geological Survey Map Views
- Appendix 6: Regional Cost-Benefit Analysis Datasets
- Appendix 6a: Questionnaire Data Schema
- Appendix 6b: State Geological Survey Reporting Schema
- Appendix 7: Chapter 8 Supplemental Figures and Tables
