Chapter 4: Cost for Geological Mapping
Abstract
Spending on geological mapping within the National Cooperative Geologic Mapping Program (NCGMP) from 1994 to 2019 was reported by State Geological Surveys (SGS) and the U.S. Geological Survey (USGS). These funds were commonly overmatched by SGS. In addition, SGS also received third-party funding (public and private). In 2020 U.S. dollars, the total cost for geological mapping from all sources was $1.99 billion from 1994 to 2019. State and other non-USGS funds amounted to $362.6 million or 18.3% of the total. Geological maps differ in scale, geographic area covered, geological formations targeted, as well as specific commodities or types of derivative products such as for geological hazards and pollution potential. It was not practical to break down the mapping costs by the various derivatives nor separate costs associated with traditional surface/near surface geological mapping from 3D subsurface mapping and modeling. The total spending over the 26 years is used in this study to compare with estimates of economic values, also independent of the specific nature of maps used, as stated by the responding stakeholders.
4.1: Results and Discussion
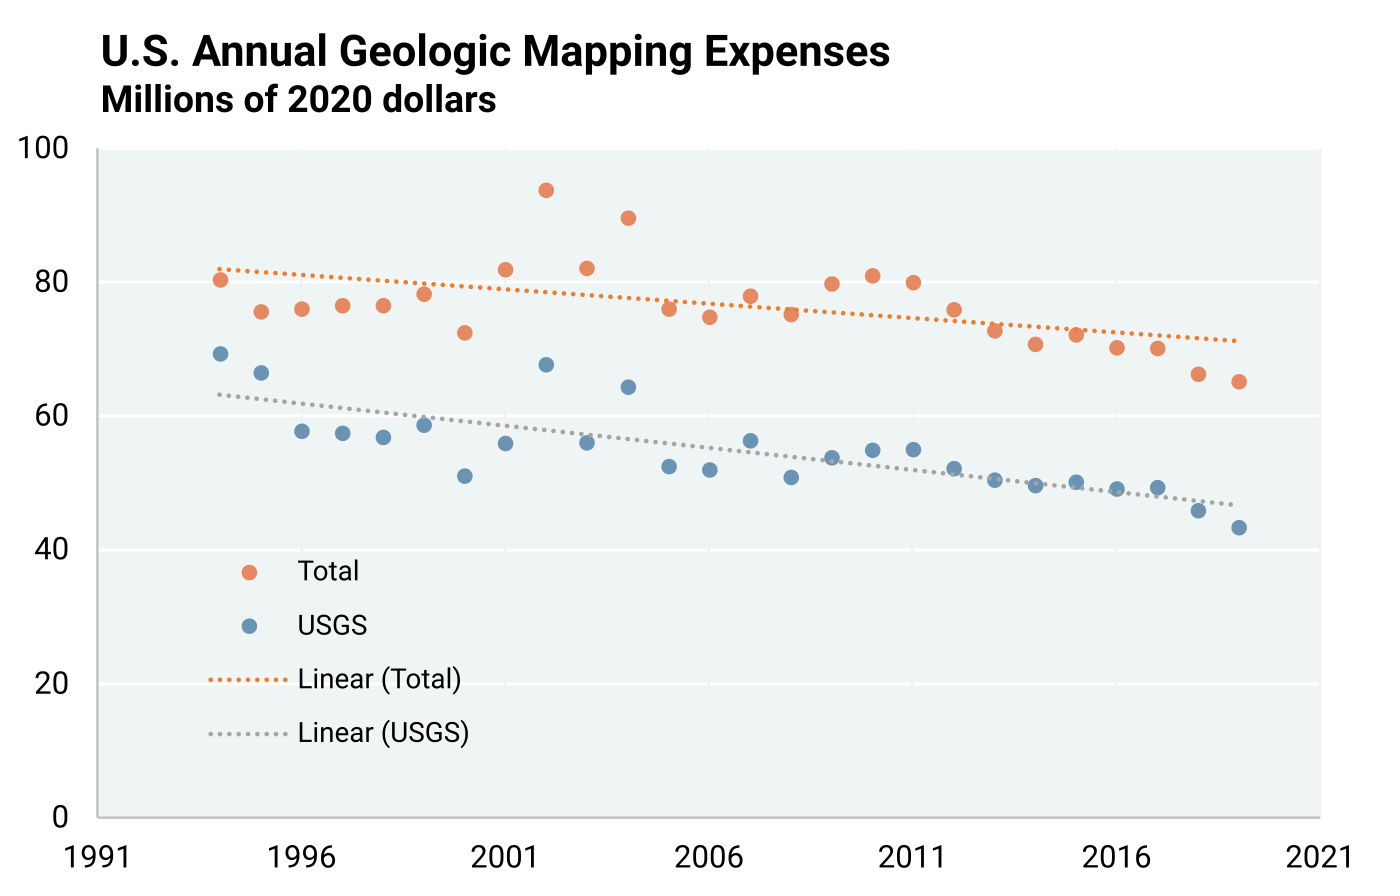
The spending on geological mapping and related research within the National Cooperative Geologic Mapping Program (NCGMP) of the U.S. Geological Survey (USGS), as well as from other sources, was reported by State Geological Surveys (SGS) and the USGS from 1994 to 2019. Data reported by SGS included funds received from the USGS (STATEMAP component of the NCGMP), required matching funds contributed by SGS, as well as third-party funding (public and private). The annual SGS/USGS expenditures on mapping were converted to 2020 U.S. dollars using the national Consumer Price Index (CPI). The total spending in the 26-year period amounted to $1.991 billion (2020 US$) with $1.43 billion expended by the USGS (72%) and $563.9 million (28%) by SGS.
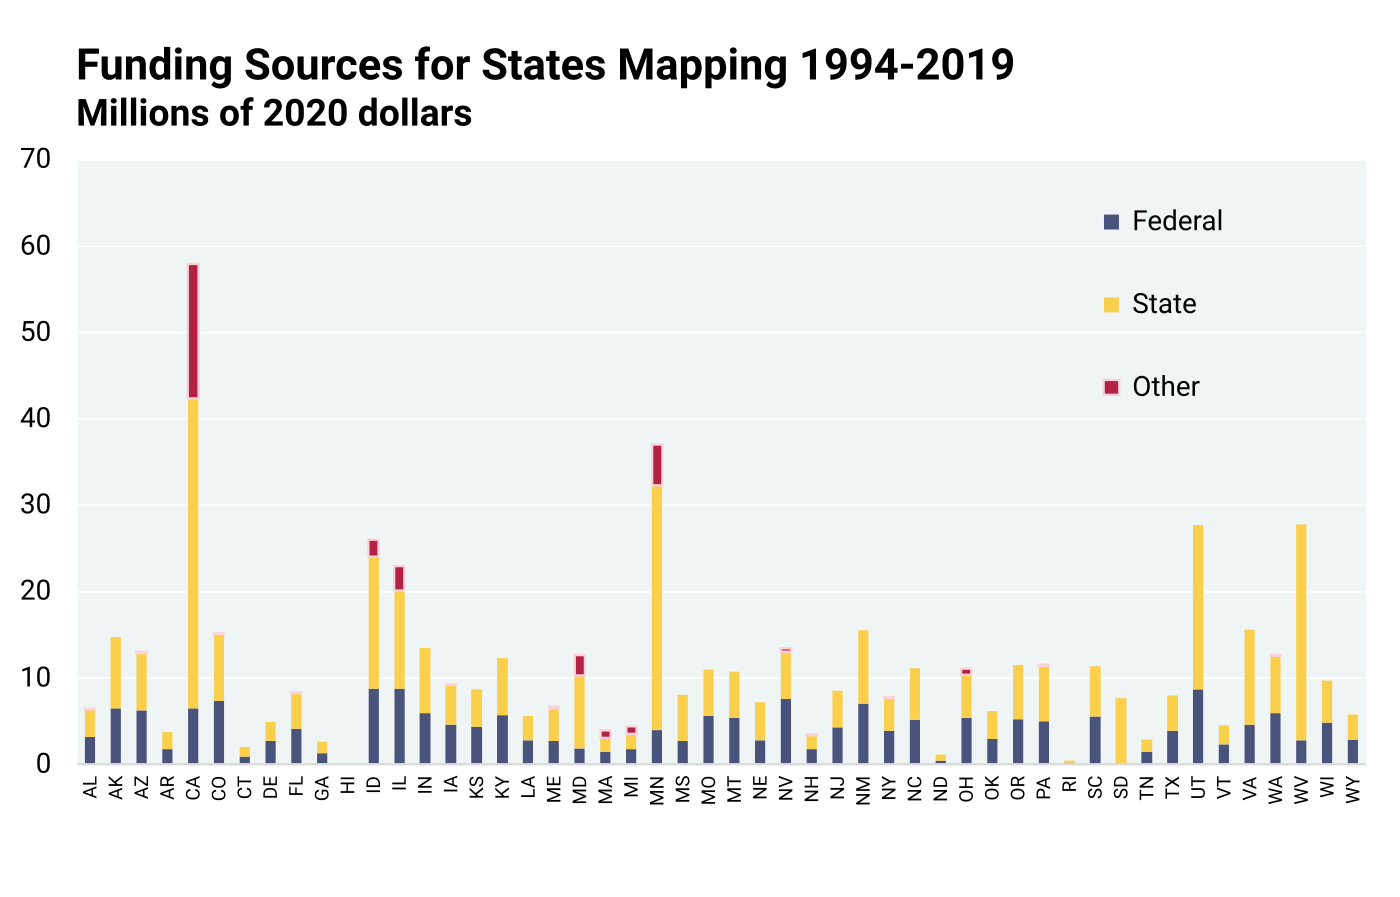
Figure 4.1.1 shows considerable fluctuations of mapping expenditures during 2000–2004 and an overall declining trend over the study period. For many years, and particularly starting around 2003, the actual dollar amount of available, congressionally-appropriated federal funds for geological mapping remained fairly constant and did not keep pace with inflation. Therefore, the inflation-adjusted downward funding trend is evident. However, not captured in this study with an ending year of 2019, federal funding for geological mapping increased by $10 million in 2020, $6 million in 2021, and $2 million in 2022. Figure 4.1.1 shows the difference between the USGS expenditure and the total expenditure, including funds spent by SGS. Figure 4.1.2 provides an overview of SGS spending by source. The total amount spent by states from 1994–2019 was $563.9 million, of which $201.3 million came from the USGS, $331.4 million from state’s budgetary allocations, and $31.2 million from other state sources, private and public. Several SGS spent more than the 1:1 matching required by the USGS. Non-USGS funds spent by SGS totaled $363 million, or 1.8 times the amount received from the USGS.
Assigning expenditures to specific maps created during the study period is complicated, because maps are revised, worked over, and improved over time. Their current form may be the result of such revisions extending much farther back into the past than the 1994–2019 project period. For example, the 707 geological quadrangles (1:24,000 scale) in Kentucky were mapped from 1960 to 1978 with USGS financial support (Cressman and Noger, 1981), but revisions and new mapping continues. The NCGMP has been operational long enough to allow the total spending in this period ($1.99 billion) to be used as the basis of assessment of mapping costs. However, geological maps themselves are not a uniform product. They focus on various aspects of geology, such as the bedrock, Quaternary deposits, or derived interpreted applications. They also differ in scale. In addition, they can differ by the specific purpose for which they were developed, like the many derivative or interpretive maps that are developed from them.
Lastly, this analysis focuses on geological mapping that traditionally depicts two-dimensional representations of the composition, spatial relationships, and age of rocks at, near, and below the Earth’s surface and commonly do so by covering large regions where three-dimensional geological information is displayed on the surface (e.g., mountainous terrain). These traditional maps are generally accompanied by a few cross sections depicting areas of the shallow subsurface, but not “true 3D”. Beginning in the early 1980s, there has been a very slow increase in 3D subsurface mapping and modeling (MacCormack et al., 2019), which portray “blocks of Earth”. However, subsurface data acquisition costs have significantly slowed progress. For those few regions of the U.S. where 3D mapping and modeling has been accomplished, those costs were included in the above $1.99 billion, but no attempt was made to separate out allocations for the 3D mapping. For all of the above reasons, it is therefore not possible to disaggregate the money spent on mapping to determine the actual cost of each type of map.


4.2: References
Cressman, E.R., and M.C. Noger, 1981, Geologic mapping of Kentucky – A history and evaluation of the Kentucky Geological Survey: U.S. Geological Survey mapping program, 1920–1978: U.S. Geological Survey Circular 801, 22 p.
MacCormack, K.E., R.C. Berg, H. Kessler, H.A.J. Russell, and L.H. Thorleifson, 2019, 2019 synopsis of current three-dimensional geological mapping and modelling in geological survey organizations: Alberta Energy Regulator/Alberta Geological Survey AER/AGS Special Report 112, 307 p.
Table of Contents
- Abstract
- Acknowledgements
- Executive Summary
- Chapter 1: Introduction
- Chapter 2: Study Objectives and Methodology
- Chapter 3: Stakeholder Assessment of Map Producing Agencies
- Chapter 4: Cost for Geological Mapping
- Chapter 5: Geological Mapping Program Activities — Critical Components
- Chapter 6: Benefits of Geological Mapping: Quantitative Assessment of Responses to Stakeholder Questionnaire
- Chapter 7: Geological Map Demand and Economic Estimates of Costs and Benefits
- Chapter 8: Regional Variations in Costs and Benefits of Geological Mapping
- Chapter 9: Quantitative Value Assessment from Independent EPA Data
- Chapter 10: Qualitative Assessment of Value of Geological Maps by Stakeholders
- Chapter 11: An Economic Model of General Geological Mapping Applications
- Chapter 12: Stakeholder Input about Future Geological Mapping
- Chapter 13: Lessons Learned and Suggestions for Future Analyses
- Chapter 14: Summary and Conclusions
- Appendix 1: Cost Sheet Template
- Appendix 2: Questionnaire to Stakeholders
- Appendix 3: Example Solication Letter Requesting Stakeholders to Participate in National Cost-Benefit Assessment
- Appendix 4: Summary Statistics, Outliers, and Confidence Intervals
- Appendix 5: Annual State Geological Survey Map Views
- Appendix 6: Regional Cost-Benefit Analysis Datasets
- Appendix 6a: Questionnaire Data Schema
- Appendix 6b: State Geological Survey Reporting Schema
- Appendix 7: Chapter 8 Supplemental Figures and Tables
