Chapter 5: Geological Mapping Program Activities — Critical Components
Abstract
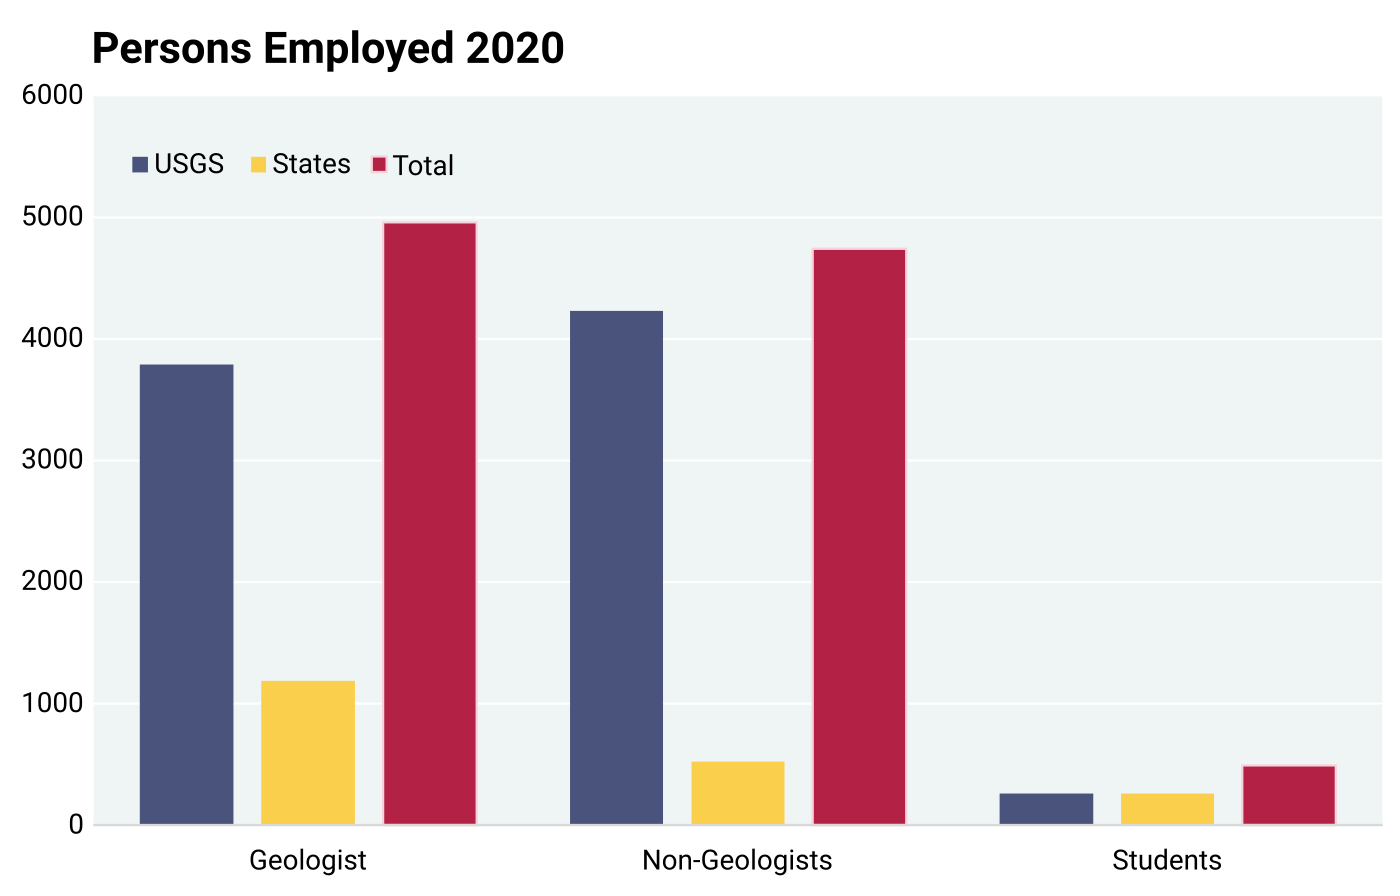
Recognizing the value of accountability of the mapping program, State Geological Surveys (SGS) and the U.S. Geological Survey (USGS) provided as much information as possible about how their funds were spent, what types of mapping were accomplished, and the extent of mapping coverage that was achieved. SGS and the USGS employed 24% and 76%, respectively, of total geologists in geological surveys in the U.S in 2020–21. Their salaries, travel, and equipment comprised the bulk of funds expended over 26 years. Mapping by USGS scientists emphasized smaller, more regional scale mapping, whereas SGS provided larger scale, more localized or detailed maps in addition to some regional scale mapping. The USGS accomplished 87% coverage in small scale mapping of the Quaternary nationwide and 20% of the bedrock. It was revealed that recordkeeping and reporting of geological mapping accomplishments needs greater attention by SGS. Only 28 states reported data on large-scale Quaternary mapping, with 21 of them reporting area coverages of < 30%. Medium-scale Quaternary mapping was reported by 20 SGS, all but four of which reported < 30% coverage. Only nine SGS reported small-scale Quaternary mapping, but they reported 100% coverage in at least one of the small scales. Large-scale bedrock mapping was reported from 36 SGS, three of which reported 100% coverage. Medium-scale bedrock mapping was reported by 19 SGS, four of which reported 100% coverage. Small-scale bedrock mapping at 100% coverage was reported by 12 of 14 SGS. Paper map sales have been declining for many years. However, e-visits for geological maps, data, and reports have been increasing. Data reporting on e-visits began in the late 1990s. The trend indicated that electronic information transfer will gradually replace traditional paper versions of geological maps. Lastly, SGS and the USGS produced a list of 73 map products derived from geological maps recognizing that derivative geological maps address specific societal needs. They also provided a status of derivative map availability, those that need revision, and desired future derivative maps.
5.1: Introduction
As reported in Chapter 4, the total spending for geological mapping by State Geological Surveys (SGS) and the U.S. Geological Survey (USGS) over the 26-year (1994–2019) period totaled $1.99 billion (2020 US$). This chapter discusses how those funds have been spent on geological mapping. However, the discussion does not focus on specific dollar amounts (as that would be well beyond the scope of this report), but rather on the personnel, mapping activities, and overall accomplishments over the 26-year period. Major expenditures would include salaries for scientists and support staff, travel expenses for fieldwork, various hardware and software for map preparation and production, and website development. The cost sheets distributed to SGS and the USGS asked, in addition to actual mapping costs as discussed in Chapter 4, for information on the (1) annual number of visitors to their websites; (2) geological mapping that was accomplished from 1994 to 2019 on a square mile and percentage of jurisdiction basis; (3) extent of geological mapping at various scales (from > 1:24,000 to < 1:500,000 and, if possible, the split between Quaternary and bedrock mapping products); and (4) status of derivative mapping including present-day availability, updating needs, and desired future products.
5.2: Staffing at State Geological Surveys and the U.S. Geological Survey
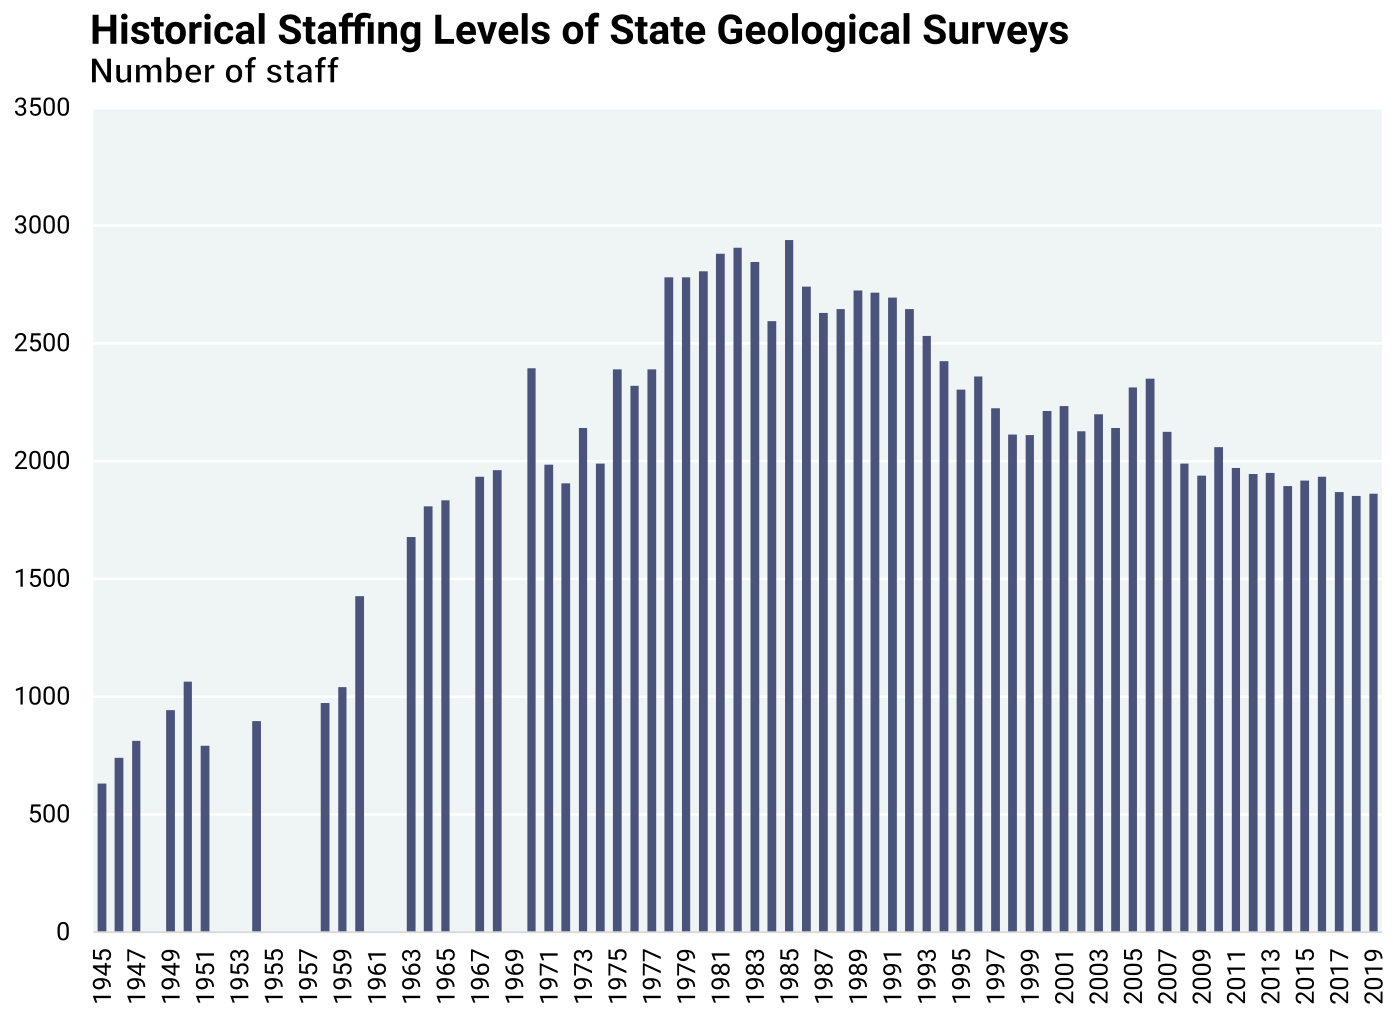
Geological research and mapping are among the prime missions of SGS and the USGS, and as such, employment of geologists and other support professionals has great significance and bears considerable costs of all mapping programs. Data reported by SGS and the USGS in 2020–2021 (Figure 5.2.1) show that of all the geologists employed by these institutions, 76% were employed with the USGS and 24% with SGS. Figure 5.2.2, from the Association of American State Geologists Statistical Report, shows staffing trends from 1945 to 2019 at SGS. The early/mid 1980s experienced peak staffing at nearly 2,800, followed by a precipitous decline. Noteworthy over the 1994 to 2019 project period is the staff decline from about 2,300 to 1,800 that began in the early 1990s. Numerous budgetary issues at the state government/university level are to blame.
5.3: Website Visits
Any estimation of cost per map or value of a map without reference to the type, scale, or specific use can only be an approximation. As will be discussed later (Chapter 7), records of geological map sales are not easy to acquire because of staffing and funding constraints and record keeping problems, all experienced by the mapping agencies. Additionally, increasing numbers of map users now access maps in digital format, as the capabilities of mapping agencies have improved to provide them online. To keep up with an ever-increasing demand and the optimum most up-to-date and user-friendly technology, SGS and the USGS have allocated considerable funds for hardware and software and have been required to hire IT professionals, as well as additional mapping staff trained in geographic information systems (GIS) and, most recently, geomodelling. Chapter 7 discusses in more detail the issues associated with providing online access to geological maps.
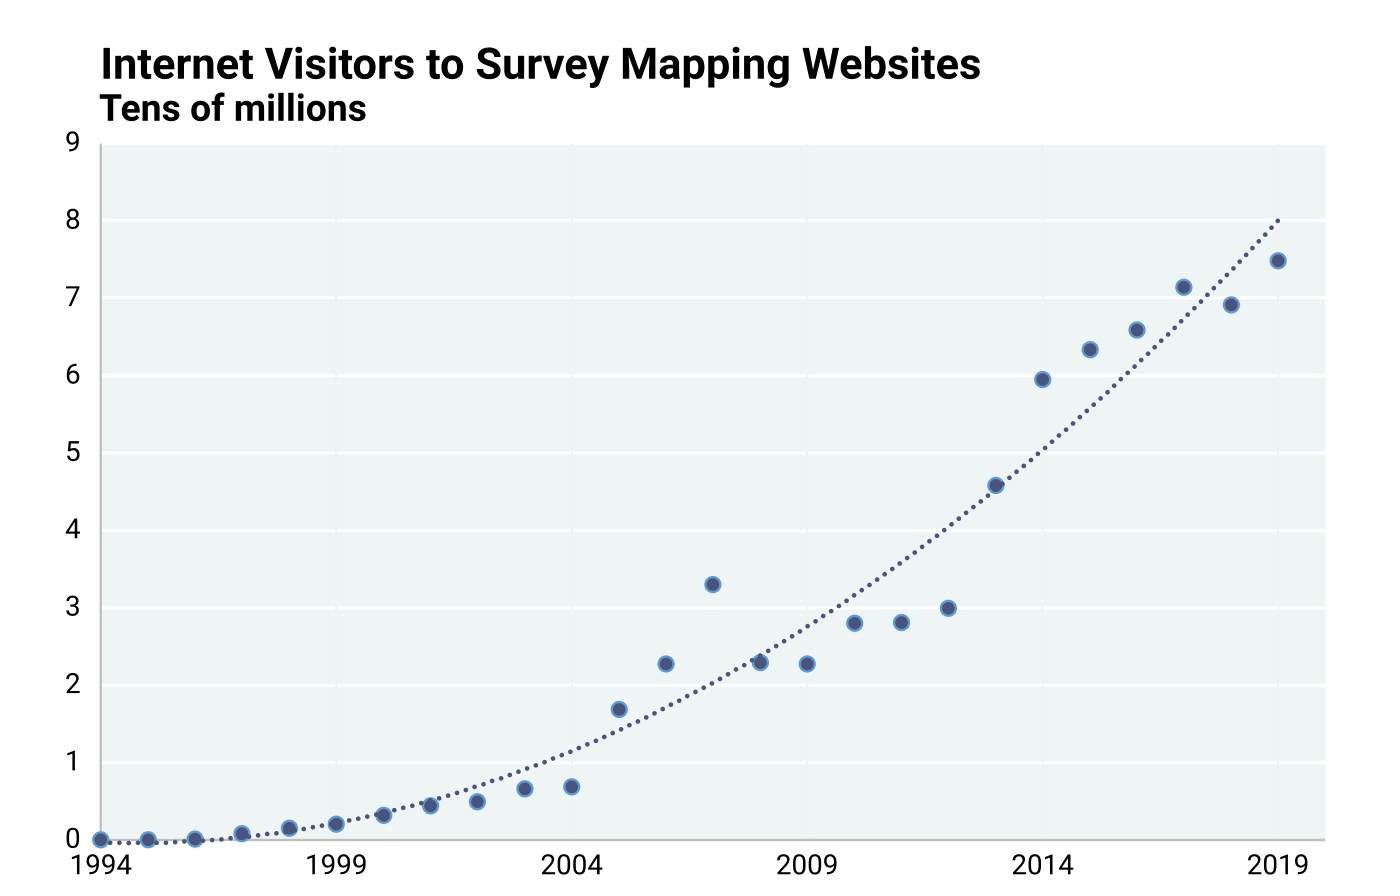
To gain a first glimpse of the effects of computerization and accessing geological maps and related information, SGS and the USGS reported annual e-visits (electronic visits) to their web pages. Although e-visits are not necessarily the same as visits to the geological map page or map downloads, the increase in e-visits was observed in parallel with the decline in sales of printed maps. Twenty-nine states reported e-visitor data at least for one year. Four states reported e-visitors beginning in 2000, seven states reported e-visitors beginning in 2005, 11 states reported e-visitors beginning in 2010, 23 states reported e-visitors beginning in 2015, and 26 states reported e-visitors beginning as recently as 2019. The USGS reported e-visit data starting in 1997. The total number of e-visits increased exponentially from 1994 to 2019, as shown in Figure 5.3.1.
Some agencies could monitor and count e-visits to specific pages, where geological maps and related data were viewed and downloaded. The trend is clearly toward more complete reliance on electronic access, not only for maps but also for other relevant geological data and reports.
5.4: Geological Mapping Accomplishments
Data on mapping accomplishments, as reported by SGS and the USGS, refer to cumulative historic accomplishments from 1994–2019. Mapping accomplishments were reported in terms of square miles mapped, as well as in the percent of the total area of their respective jurisdictions that have been mapped. The percentage area covered is discussed here, because it provides a means to assess how much work has been accomplished and how much lies ahead.
Bedrock and Quaternary mapping accomplishments were reported separately. In each category, the mapping accomplishments were broken down by mapping scale. Reporting of mapping accomplishments has been uneven. Thirty-two SGS reported Quaternary mapping accomplishments, while 35 reported bedrock mapping accomplishments, and 42 SGS reported the total mapping accomplishments. These are not necessarily the same SGS in each group, and if a specific type of mapping was not reported, it should not necessarily be assumed that it has not been completed.
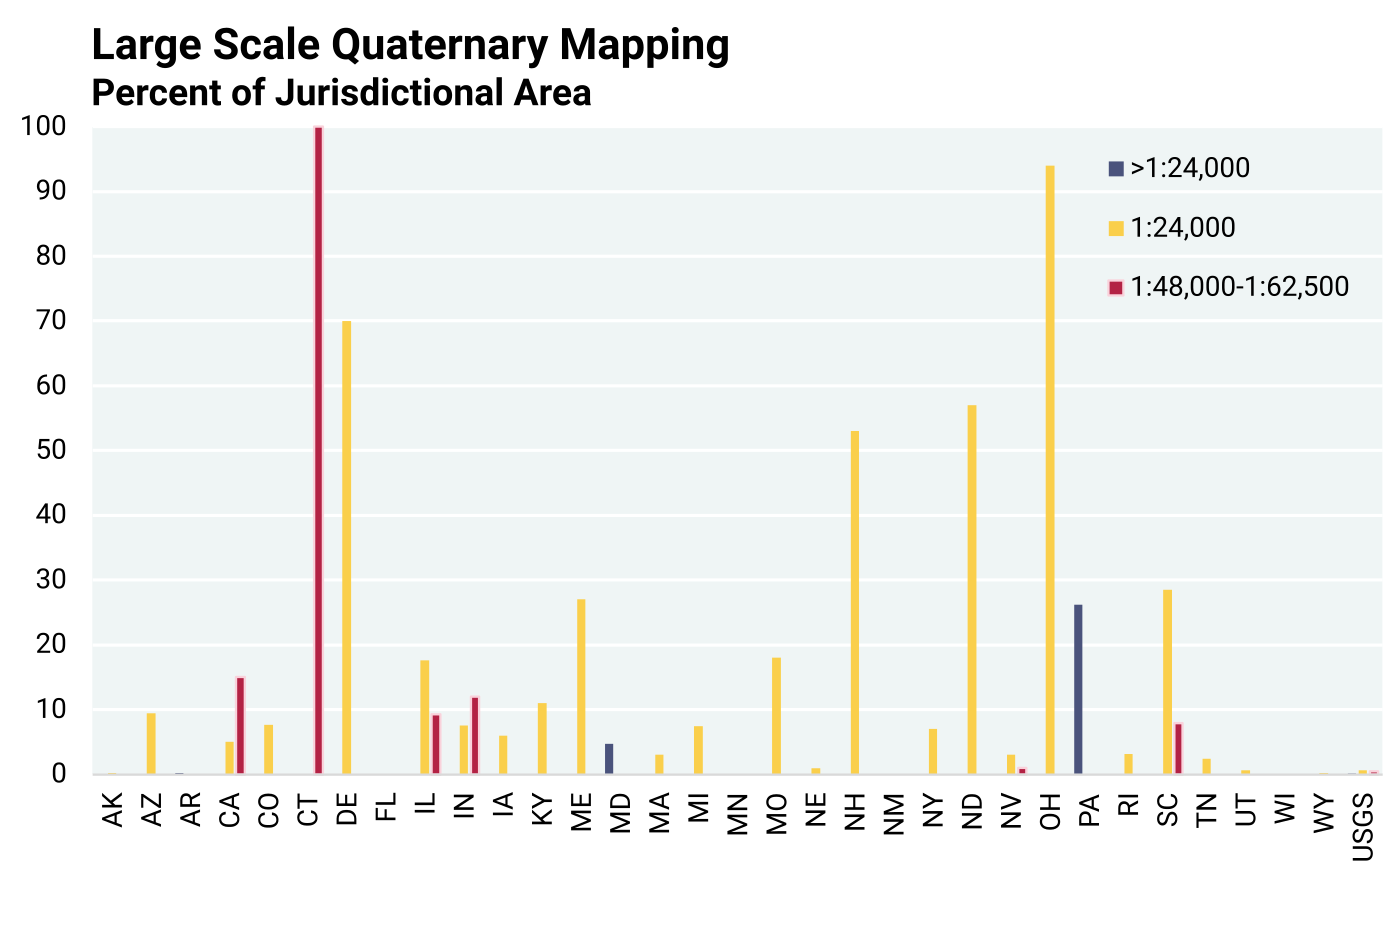
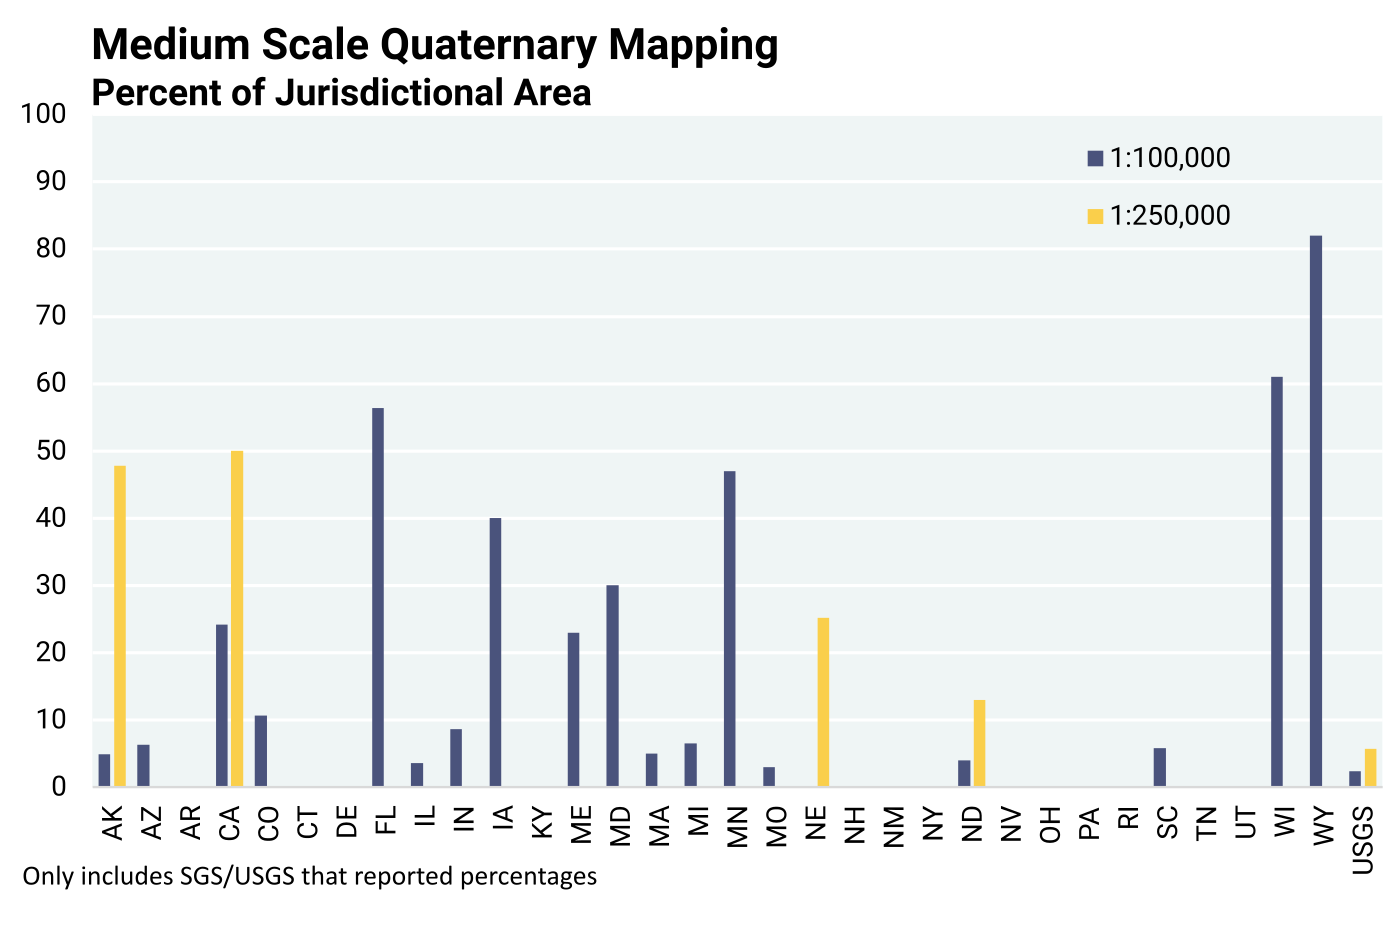
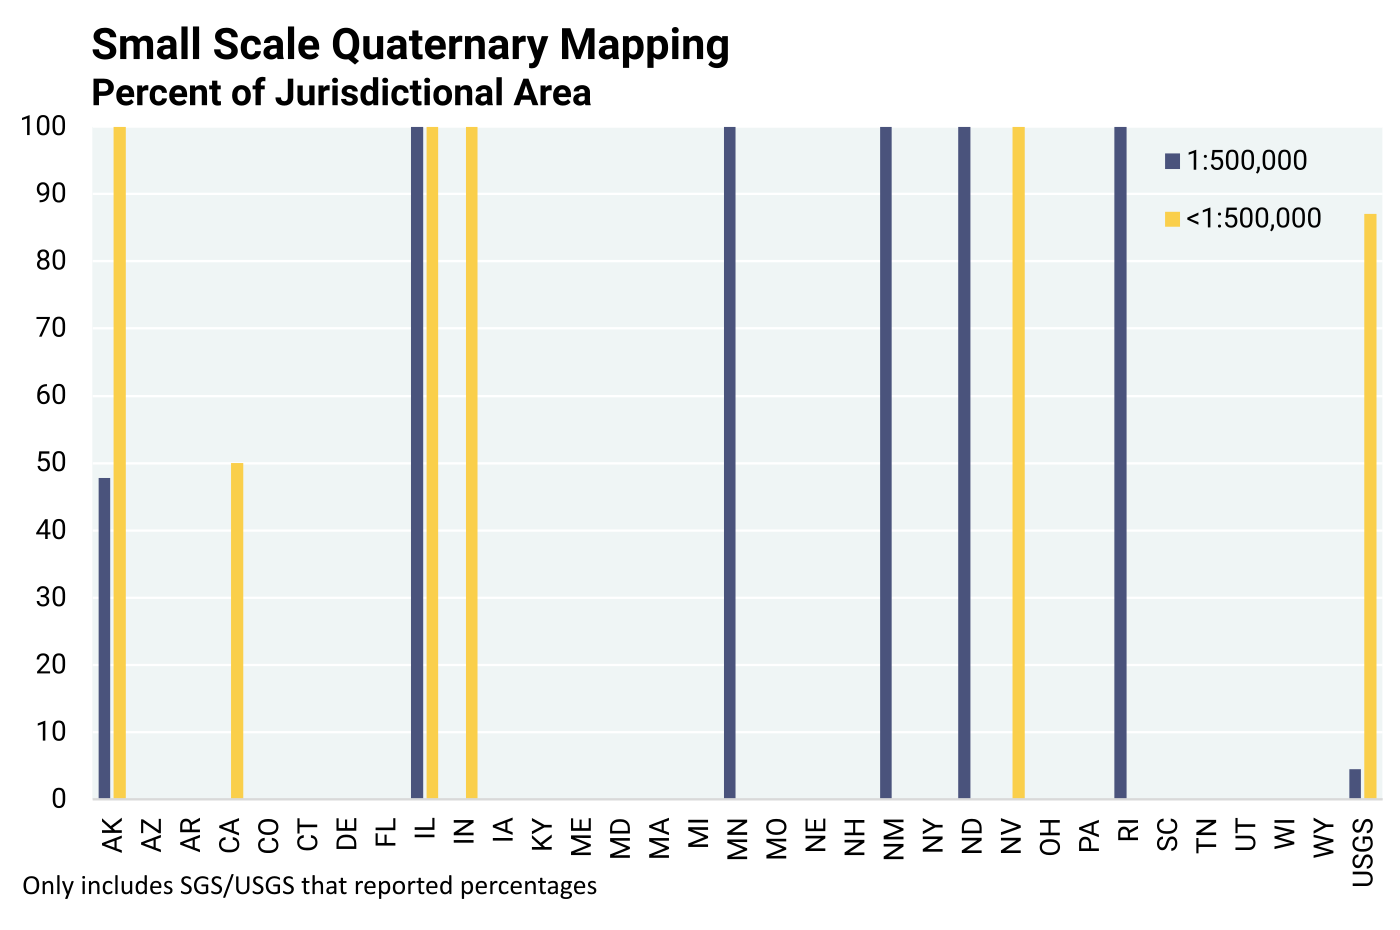
Figures 5.4.1, 5.4.2, and 5.4.3 show the reported Quaternary mapping accomplishments at large, medium, and small scale, respectively. It is important to note that small scale refers to regional or broad-scale maps, and large scale correlates with local or fine-scale maps. Small versus large scale reflects the relative size of the fraction; that is, for example, 1:100,000 is smaller scale than 1:24,000. Regionally aggregated analysis of SGS mapping expenses versus mapping accomplishments do not provide useful insights into the causes of uneven mapping accomplishments. Overall, the data show that geological mapping coverage is far from complete in most states. A visual comparison indicates some patterns:
-
The USGS accomplishments in mapping during this period were primarily at small scale (1:500,000 and 1:<500,000). According to them, 87% of the Quaternary deposits in the country have been mapped at the smallest scale of 1:<500,000, and 20% of the bedrock has been mapped at the 1:500,000 scale. In either case, the USGS emphasis on small-scale mapping facilitates larger-scale mapping in the future by SGS and others.
-
Like the USGS, SGS mapping accomplishments tend to be greater at smaller scales than at larger scales, i.e., coverages at small scale are more complete than at large scale.
-
Quaternary mapping was reported by 28 SGS in at least one of the large-scale categories. Five SGS reported >50% coverage at least at one scale, with Connecticut as the only state reporting 100% large-scale Quaternary coverage, followed by Ohio at 90%. All other states report <30% coverage. (Figure 5.4.1).
-
At medium scale, Quaternary mapping was reported by 20 SGS. California, Florida, Wisconsin, and Montana reported >50% coverage at least at a medium scale. Coverage in the remaining states was <30% (Figure 5.4.2).
-
At small scale, Quaternary mapping was reported by only nine SGS, but with 100% coverage in at least one of the scale categories, except California with 50% Quaternary coverage (Figure 5.4.3).
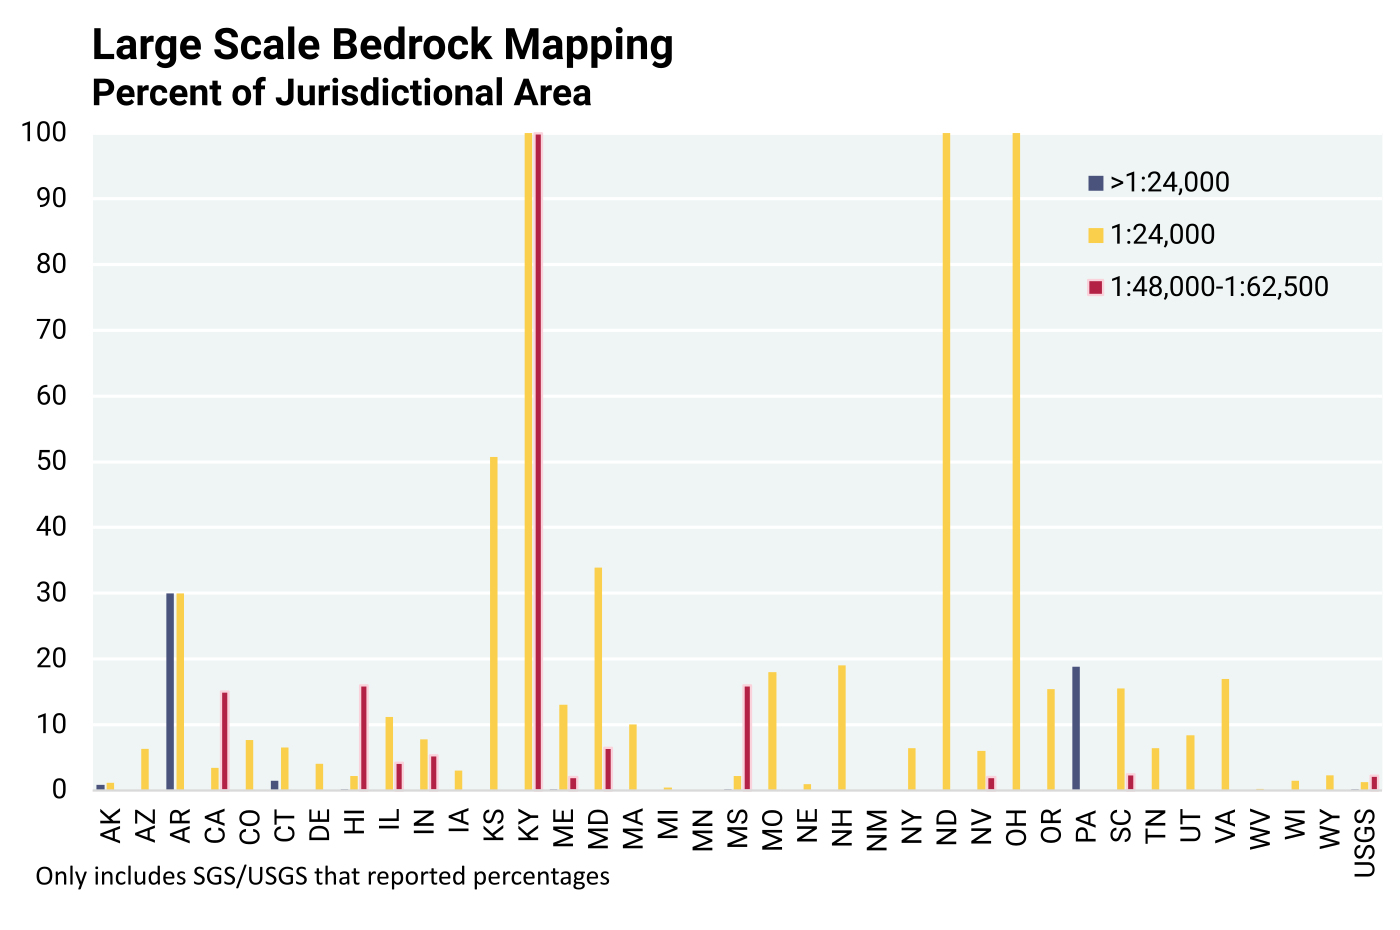
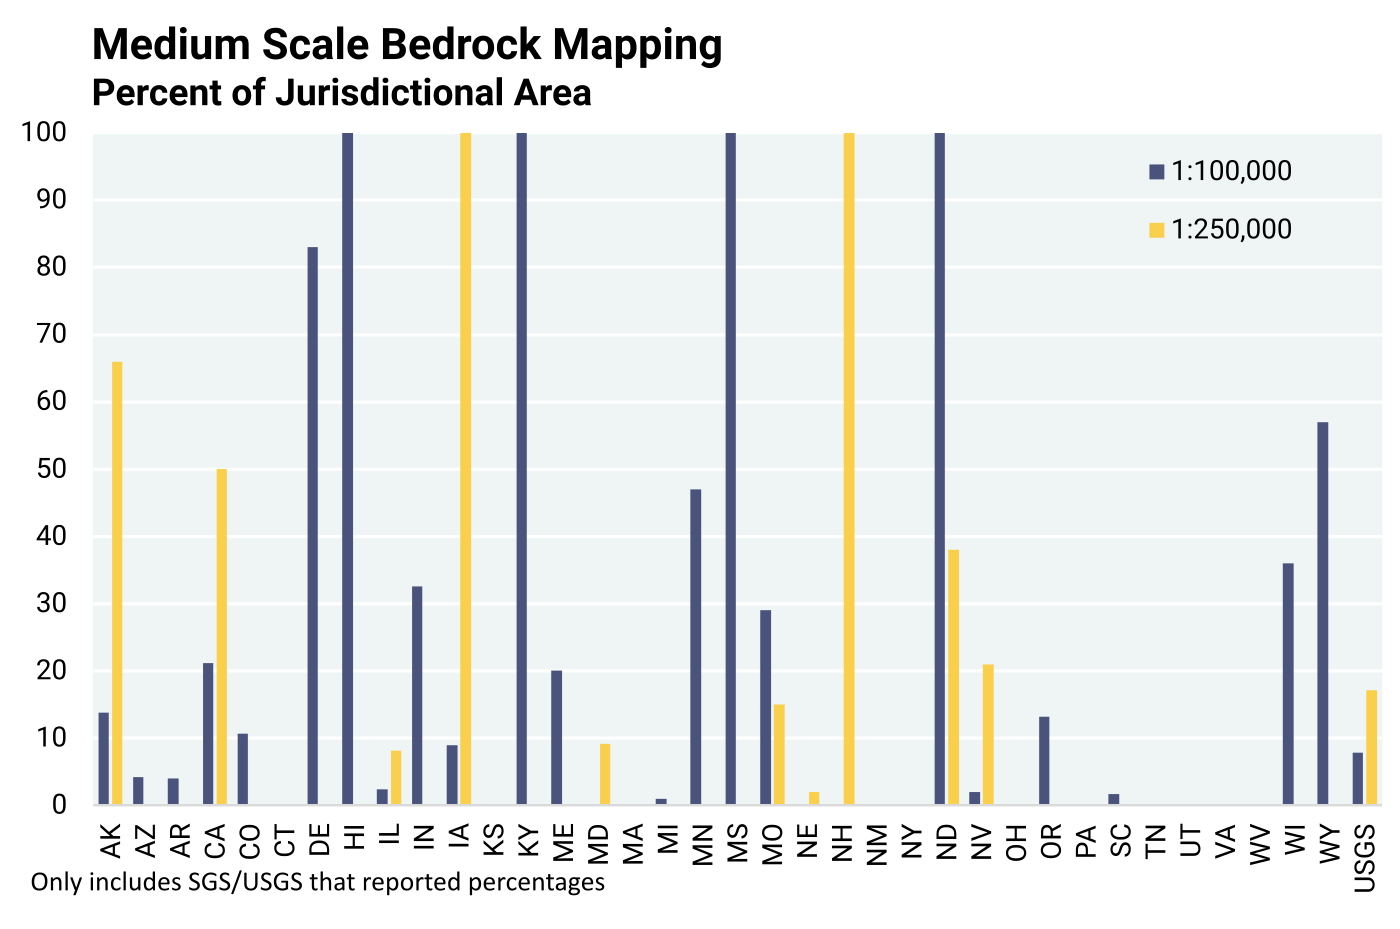
Figures 5.4.4, 5.4.5 and 5.4.6 show the bedrock mapping accomplished and yield the following key takeaways:
-
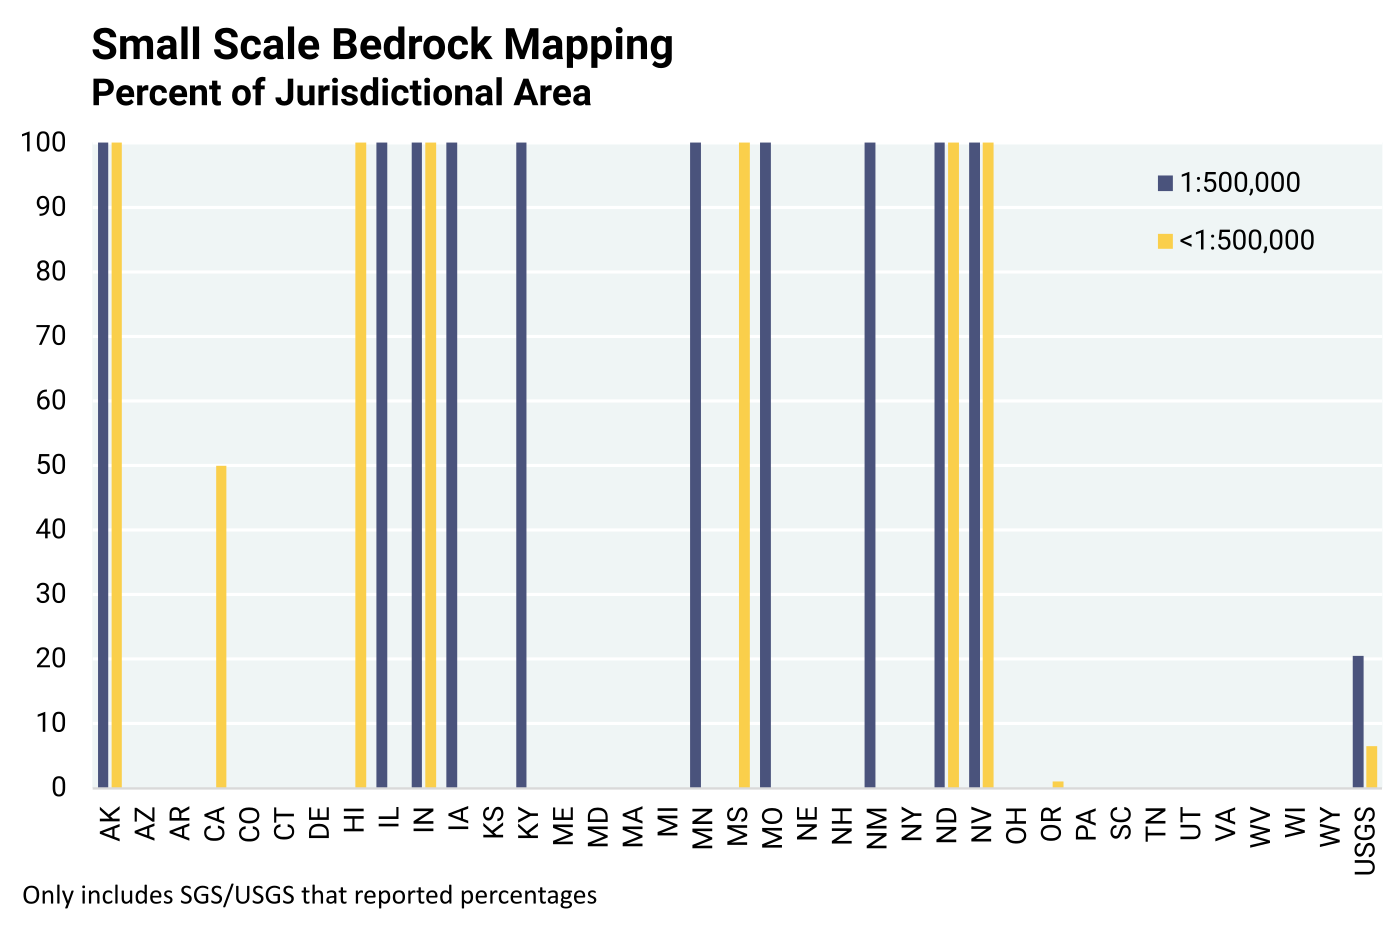
USGS bedrock mapping coverage is reported to be 20% in the small-scale category, and under 6% at larger scales.
-
Large-scale bedrock mapping was reported from 36 SGS. Kentucky, North Dakota, and Ohio reported 100% area coverage of bedrock mapping at large scale. Kansas reported 50% coverage, followed by Maryland at 33.9% and Arkansas at 30%. All other reporting SGS covered <20% of their areas. (Figure 5.4.4).
-
Eighteen SGS reported medium-scale bedrock mapping. Kentucky, Mississippi, and North Dakota have full mapping coverage in this scale category, followed by Delaware (83%), Wyoming (57%), Minnesota (47%), Wisconsin (36%), and Indiana (32.6%). The remaining 10 SGS reported <30% coverage (Figure 5.4.5). Medium-scale bedrock mapping was reported by the USGS at 100% for Hawaii.
-
Small-scale bedrock mapping coverage in 12 of the 14 reporting states was complete (100% of area). One state reported 50% coverage (California), and one state (Oregon) 1% coverage (Figure 5.4.6).
The survey did not seek explanation from SGS or the USGS regarding criteria for setting mapping priorities, with respect to mapping scales, or the Quaternary vs. bedrock options. However, all SGS are required by federal law (National Geologic Mapping Act (NGMA) of 1992, PL 102–285) to set priorities as determined by multi-representational state panels, with the objective of defining areas that the SGS determine to be vital to the economic, social, or scientific welfare of individual states.
5.5: Derivative Mapping
The stakeholder survey, analyzed later in this report, includes input about map user views pertaining to future priorities (Chapter 12), as well as scale preferences (Chapter 6). Differences in the quality and quantity of geological outcrops, as well as the depth, extent, thickness, mineralogy, and chemistry of subsurface geologic units, are some of the influences regarding prioritization of mapping. However, the overarching reasons are driven by societal issues (per NGMA requirements), such as population density, industrialization, pollution potential, water and mineral resource identification, geological hazard assessments, and the need for supporting infrastructure development and maintenance. An overarching constraint is the funding that is available to produce a “public good” such as geological maps.
SGS attend to the specific needs of their constituents by setting mapping priorities. Producing “derivative maps” is an important activity that serves specific needs of map users. The survey of SGS included queries regarding derivative maps. A selected list of 25 derivative maps was provided, but additional derivatives could be listed by SGS as well. In the final tally, a list of 73 derivative map products was revealed. Table 5.5.1 shows the 73 map products derived from geological maps. The first 25 were initially provided as options, whereas the remaining were added by respondents. Three questions concerning the status of each derivative were asked:
-
A: Is the derivative available?
-
B: Does the derivative need revision?
-
C: If it does not exist, is it desired in the future?
The responses were categorized under three scale categories: 1:100,000 or larger, 1:101,000 to 1:499,000, and 1:500,000 or smaller. These data were compiled into nine charts. A representative selection of three graphs in the largest scale category is presented on Figures 5.5.1, 5.5.2, and 5.5.3. The derivative number on the x-axes of the graphs corresponds to their number in the list below. Aggregation of data from several SGS in the course of regional interpretation provides no additional insights because of insufficient data.
Table 5.5.1. Derivative Maps
| 1. Mineral resources - general. |
| 2. Coal. |
| 3. Mined out areas. |
| 4. Hydrocarbons. |
| 5. Aggregates. |
| 6. Industrial minerals. |
| 7. Metals. |
| 8. Critical minerals. |
| 9. Hydrogeology-general. |
| 10. Aquifer delineation. |
| 11. Aquifer sensitivity. |
| 12. Soil drainage. |
| 13. Aquifer recharge. |
| 14. Geothermal. |
| 15. Geohazards – general. |
| 16. Karst. |
| 17. Slope stability. |
| 18. Engineering soil properties. |
| 19. Construction conditions. |
| 20. Tsunami potential. |
| 21. Basic research. |
| 22. Land cover. |
| 23. Surface topography. |
| 24. Bedrock topography. |
| 25. Drift thickness. |
| 26. Minerals hazards. |
| 27. Carbon capture and sequestration. |
| 28. Alluvial fan hazards. |
| 29. Landslides/mass movements. |
| 30. Earth fissures. |
| 31. Thickness of principal aquifer overburden. |
| 32. Structural features. |
| 33. Soils and parent material. |
| 34. Stacked units/3-D. |
| 35. Surface slopes. |
| 36. In-home radon potential. |
| 37. Highway maintenance costs. |
| 38. Landfill suitability. |
| 39. Geology for land use. |
| 40. Lands impacted by sea-level rise. |
| 41. Reservoir sedimentation. |
| 42. Ocean sand mapping. |
| 43. Bottom sediment classification. |
| 44. NEHRP soil classification. |
| 45. Glacial surface features. |
| 46. Bedrock valleys. |
| 47. Wetlands. |
| 48. Geophysical investigations. |
| 49. Water wells. |
| 50. Ground water quality. |
| 51. Geophysics: electromagnetic/magnetic. |
| 52. Depth to water. |
| 53. Coastal erosion. |
| 54. Potentiometric surface. |
| 55. Groundwater yield. |
| 56. Hydraulic conductivity. |
| 57. Bedrock structure. |
| 58. Carbon storage resources. |
| 59. NGL storage resources. |
| 60. Utica Shale resource. |
| 61. Brine disposal resources. |
| 62. Structural features. |
| 63. Bouguer gravity. |
| 64. Rare-Earth elements. |
| 65. Volcano hazards. |
| 66. Earthquake hazards. |
| 67. Permafrost. |
| 68. Avalanche. |
| 69. Flooding. |
| 70. Aquifer potential. |
| 71. Aquifer texture. |
| 72. Gravity. |
| 73. Magnetic. |
Figures 5.5.1, 5.5.2, and 5.5.3 depict SGS responses to derivative maps at 1:100,000 or larger. Numbers of affirmative responses are shown on the y-axes. Similar data for other scale ranges (1:101,000 to 499,000, and 1:500,000 or smaller) were collected. Graphical views of those responses display similar patterns but are not provided in this report as figures.
Some observations from Figures 5.5.1, 5.5.2, and 5.5.3 include:
-
The 25 derivatives selected by the Steering Committee for this query were appropriate.
-
The SGS added 48 derivatives that were deemed important from their regional perspectives, and these underly the importance of the SGS-USGS geological mapping collaboration.
-
The numbers of responses from SGS differed greatly from state-to-state.
-
No specifics about scale or application of derivative maps were solicited. Therefore, comparisons between regions with regard to the uses of derivative maps are not meaningful.
-
The need for a revision of available derivatives is widespread, indicating the need to continue and strengthen the mapping program to address pressing societal issues.
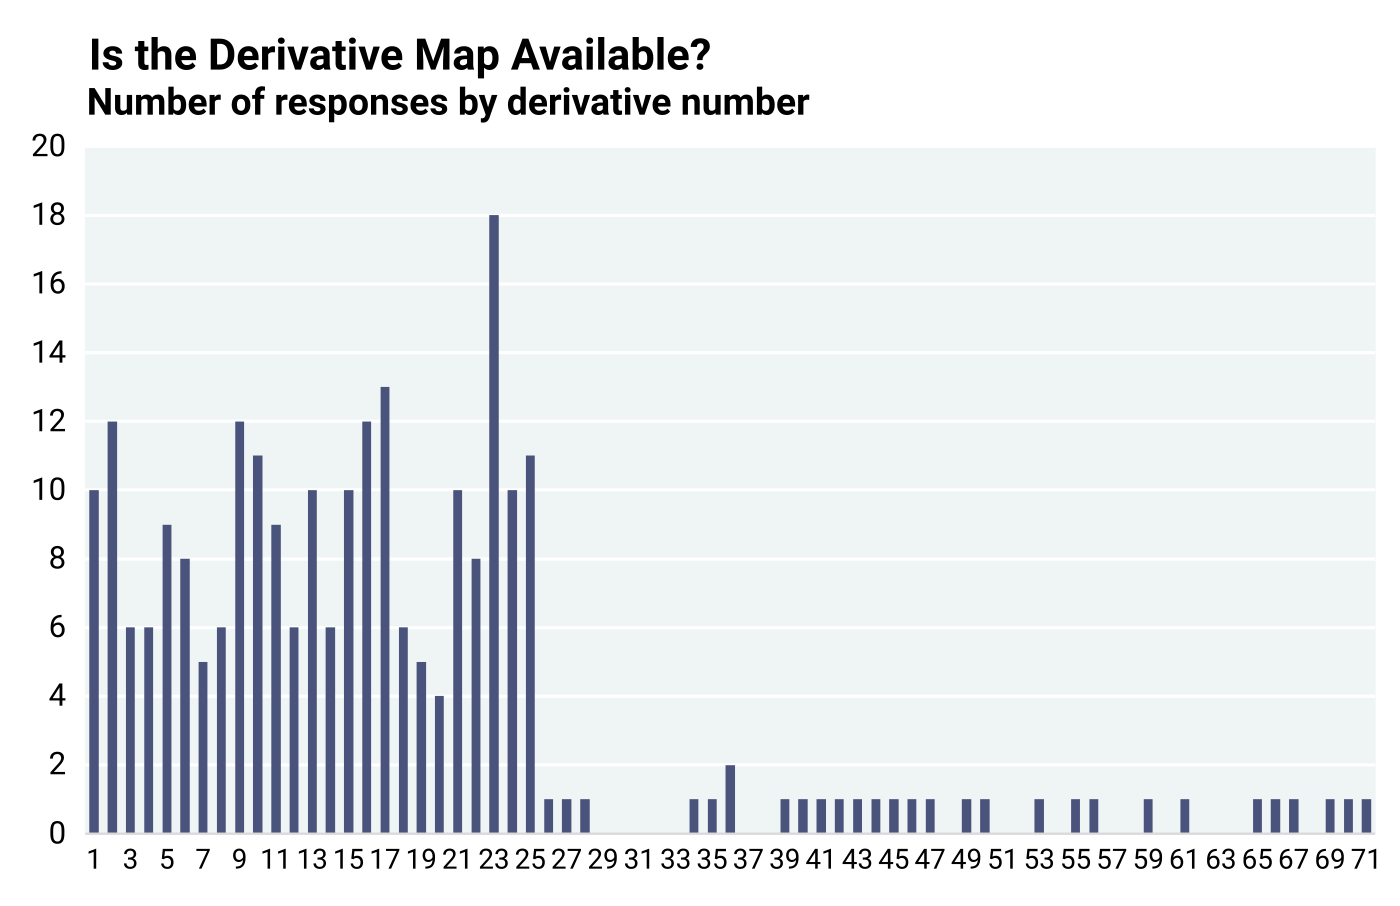
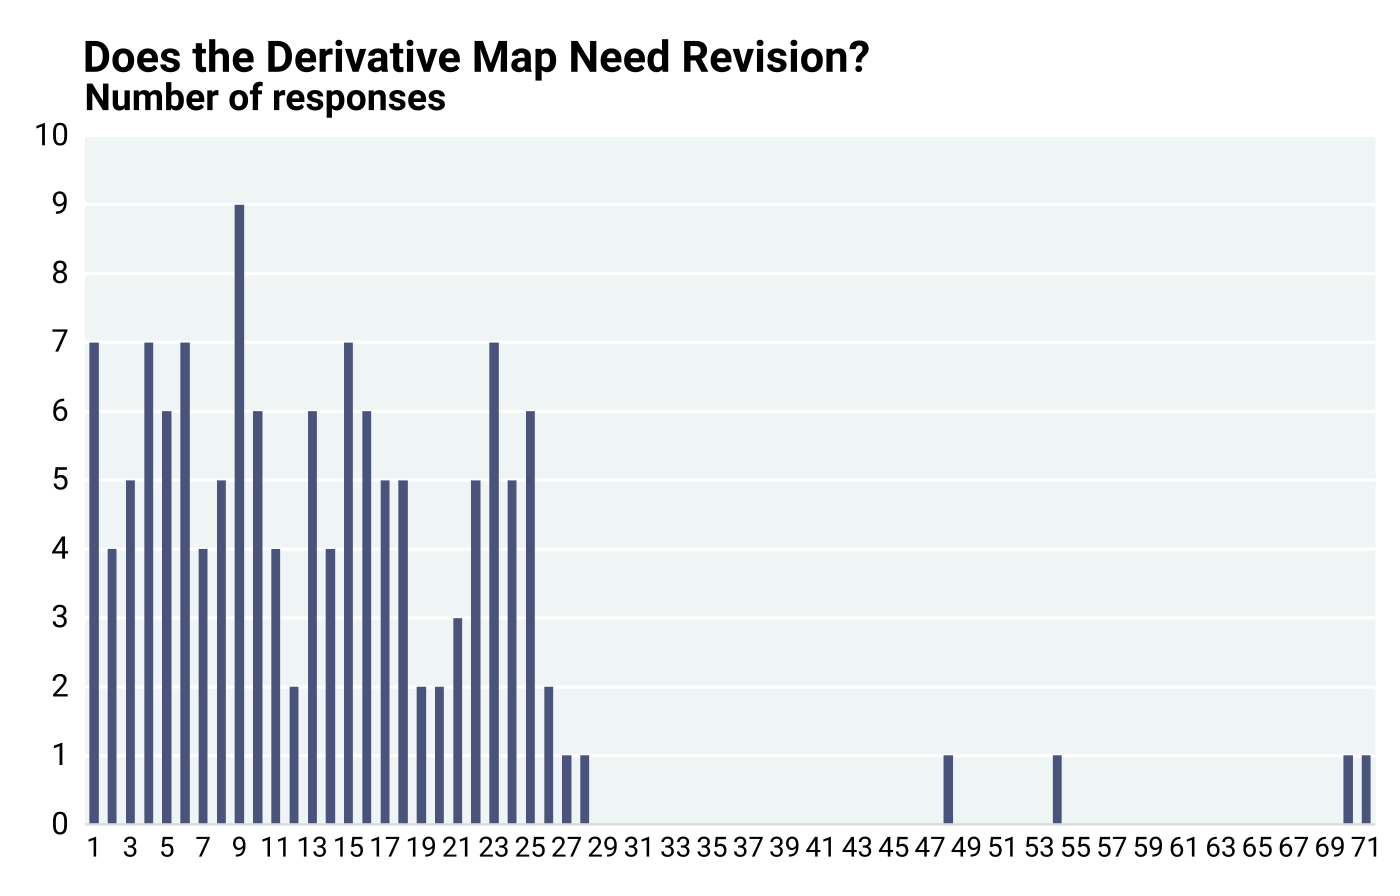
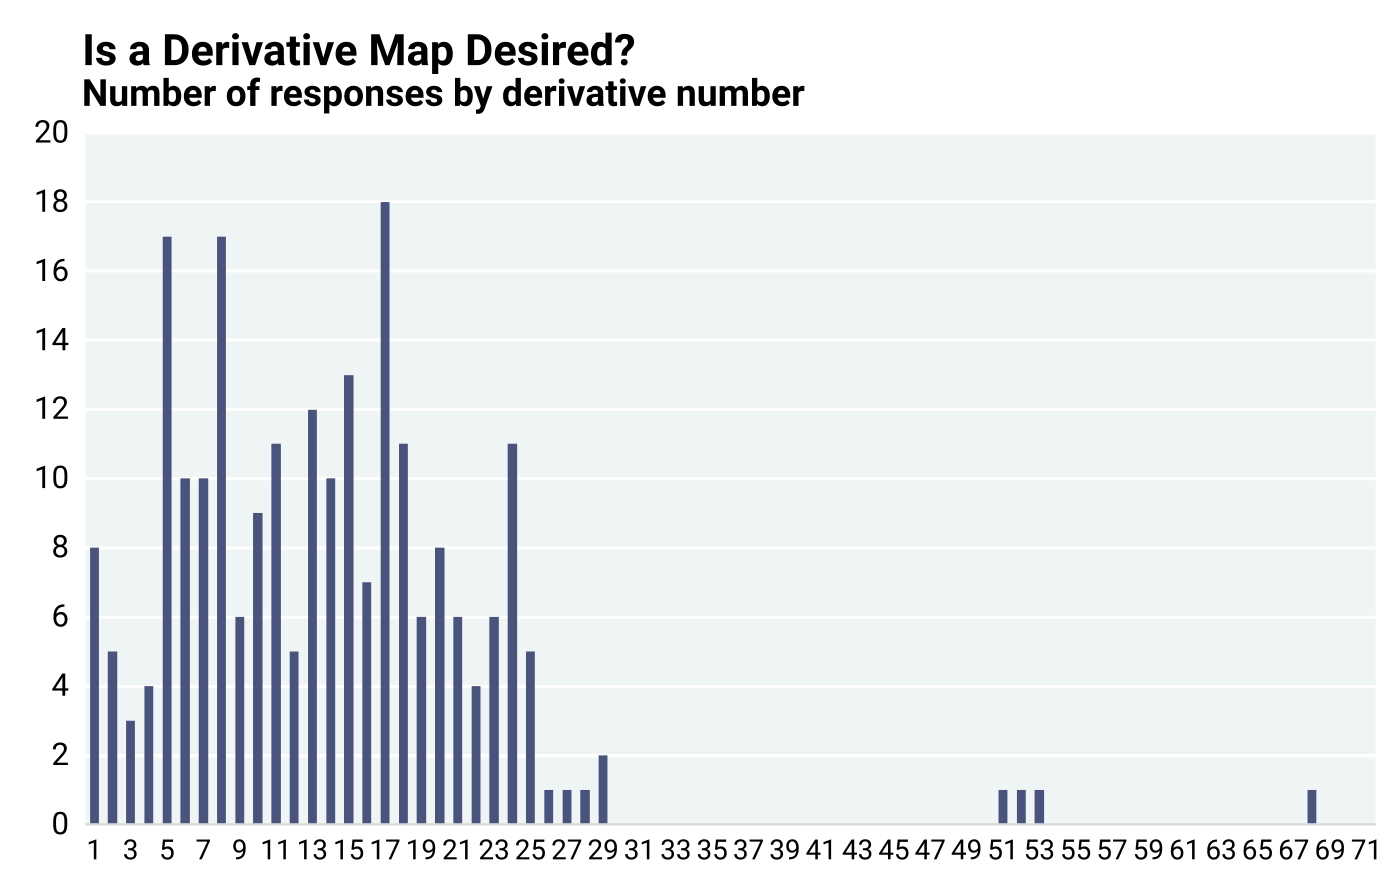
Table of Contents
- Abstract
- Acknowledgements
- Executive Summary
- Chapter 1: Introduction
- Chapter 2: Study Objectives and Methodology
- Chapter 3: Stakeholder Assessment of Map Producing Agencies
- Chapter 4: Cost for Geological Mapping
- Chapter 5: Geological Mapping Program Activities — Critical Components
- Chapter 6: Benefits of Geological Mapping: Quantitative Assessment of Responses to Stakeholder Questionnaire
- Chapter 7: Geological Map Demand and Economic Estimates of Costs and Benefits
- Chapter 8: Regional Variations in Costs and Benefits of Geological Mapping
- Chapter 9: Quantitative Value Assessment from Independent EPA Data
- Chapter 10: Qualitative Assessment of Value of Geological Maps by Stakeholders
- Chapter 11: An Economic Model of General Geological Mapping Applications
- Chapter 12: Stakeholder Input about Future Geological Mapping
- Chapter 13: Lessons Learned and Suggestions for Future Analyses
- Chapter 14: Summary and Conclusions
- Appendix 1: Cost Sheet Template
- Appendix 2: Questionnaire to Stakeholders
- Appendix 3: Example Solication Letter Requesting Stakeholders to Participate in National Cost-Benefit Assessment
- Appendix 4: Summary Statistics, Outliers, and Confidence Intervals
- Appendix 5: Annual State Geological Survey Map Views
- Appendix 6: Regional Cost-Benefit Analysis Datasets
- Appendix 6a: Questionnaire Data Schema
- Appendix 6b: State Geological Survey Reporting Schema
- Appendix 7: Chapter 8 Supplemental Figures and Tables
