Chapter 10: Qualitative Assessment of Value of Geological Maps by Stakeholders
Abstract
Geological maps offer a wide array of uses that benefit stakeholders in ways that can be difficult to quantify. Therefore, stakeholders were asked in text format to describe how maps benefit their industry or organization. About 58.4% of respondents (2,689 out of 4,599) provided explanations of what benefits they received from map use. Benefits of map use were described by respondents working in various fields from their own perspectives. Several commonalities emerged from the responses that included the following: (1) providing regional context to project area; (2) identifying and exploring for resources; (3) helping with regulatory compliance; (4) identifying hazards; (5) enhancing accuracy of decisions; (6) lending credibility to work; (7) communicating effectively; (8) educating students and officials; and (9) saving time and money.
10.1: Stakeholder Qualitative Responses
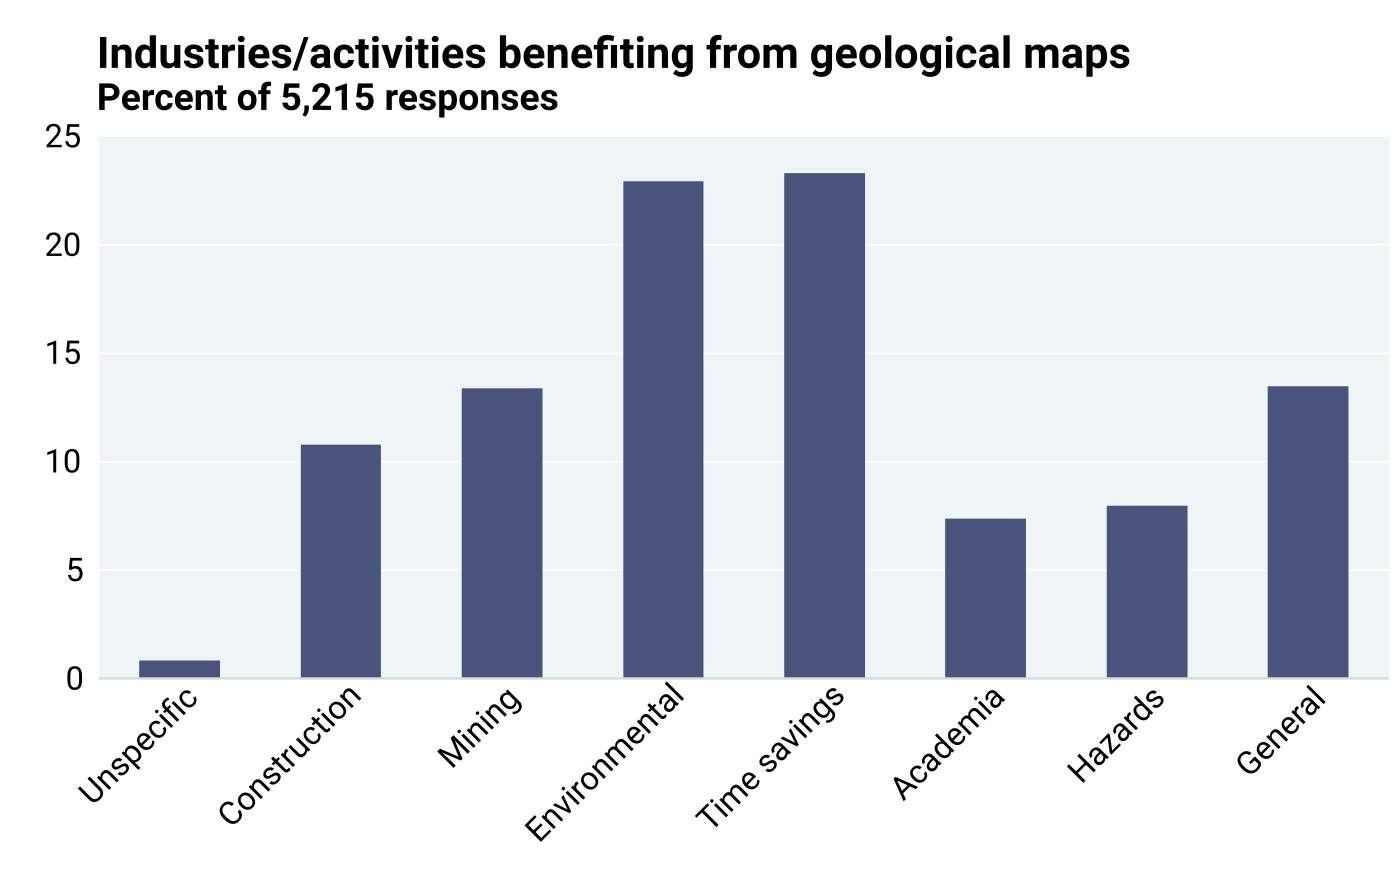
Geological maps offer a wide array of uses that benefit stakeholders in ways that can be difficult to quantify. Therefore, stakeholders were asked to describe how maps benefit their industry or organization (question 6). About 58.4% of respondents (2,689 out of 4,599) provided explanations of what benefits they received from map use. Many respondents work in multiple industries. As a result of their diverse activities, the actual number of responses was 5,215. A simplified list of search words or phrases provided an overview of the responses received and the industries that benefited from map use (Figure 10.1.1). Time saving is the single largest benefit that was cited. By inference, it can be concluded that cost savings are also a major benefit. This conclusion was reinforced in Chapter 6, which describes actual estimates by respondents of time and cost savings (in the previous five years the median value was 20% for time savings and 15% in cost savings) attributable to the availability of publicly financed geological maps prepared by State Geological Surveys (SGS) and the U.S. Geological Survey (USGS). Benefits in conducting environmental work are cited by an almost equal number of respondents. A detailed reading of a sample of about 200 responses provided better insight into how geological maps benefit users, as summarized below:
- Identify resources.
- Provide regional geological context.
- Aid construction safety.
- Save time.
- Save cost.
- Aid grant writing.
- Assist exploration planning.
- Help regulatory compliance.
- Hazard identification.
- Aquifer recharge planning.
- Assist environmental work.
- Communication with the public.
- Educate students.
A criterion for assessing the quality of the geological maps produced by SGS and the USGS is the stakeholder trust in these publicly funded independent institutions, and if use of their maps helps improve the quality/accuracy of their decisions (question 19). Close to 89% of respondents reported a “notable” or “extreme” improvement in the quality of their decisions if they use maps from SGS and the USGS (Figure 10.1.2).
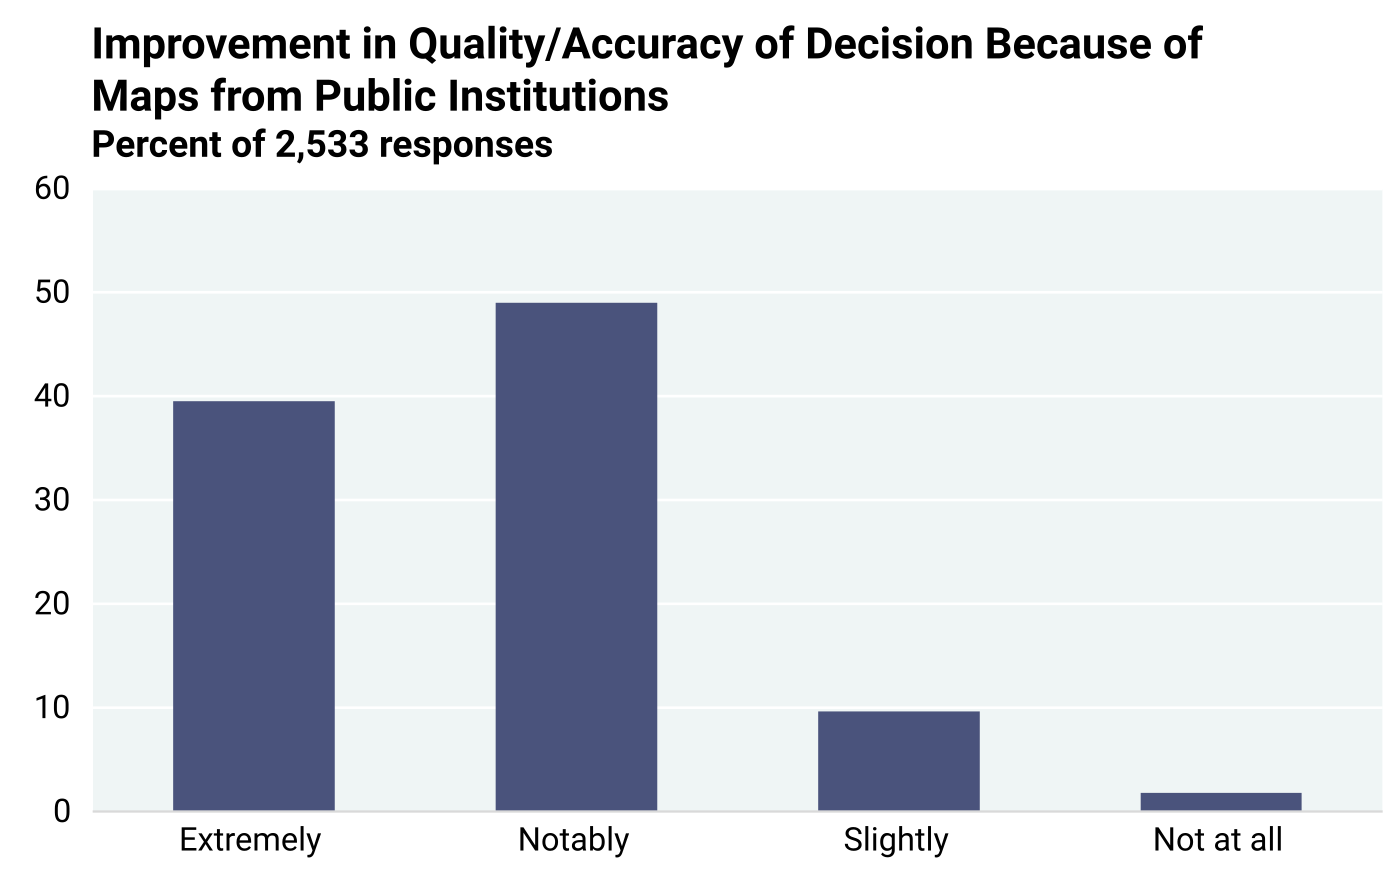
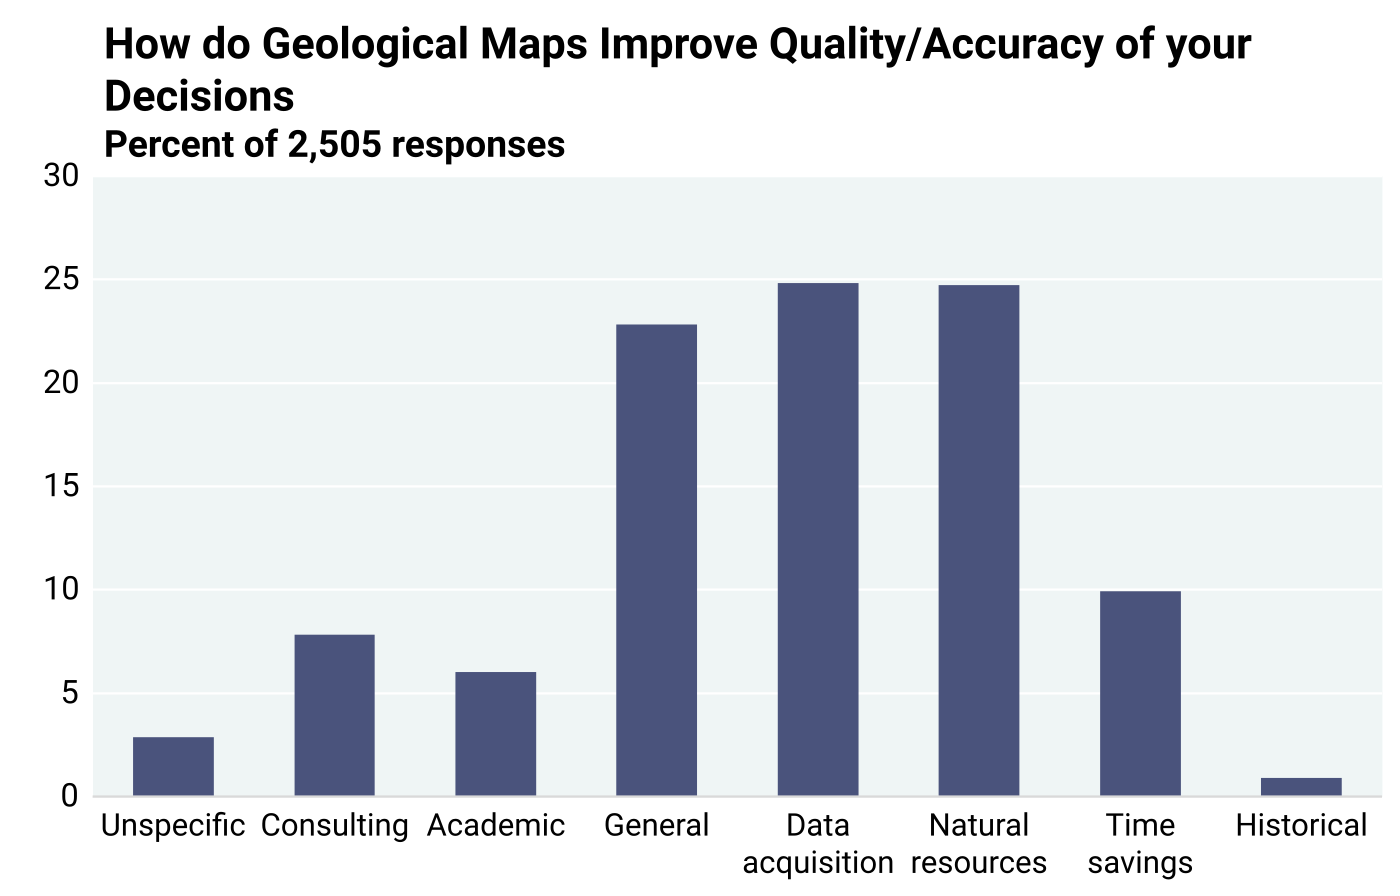
Figure 10.1.3 shows the application areas in which geological maps help improve the quality/accuracy of decisions. A closer reading of responses in each of the categories in Figure 10.1.3 provides greater insight. The following bullet points, based on extensive reading of specific responses, summarize comments within several broad topical areas as shown on Table 10.1.1.
The quality and accuracy of the work by map users/stakeholders are vitally important. Commonly, however, as in courts of law and compliance issues, the work submitted by project managers must appear credible. The independent geological expertise of public institutions substantiates the credibility of the work of the users (question 20). Stakeholders were asked to respond to the credibility aspect by selecting one of the four descriptions provided to them and explain their choices. Figure 10.1.4a is a breakdown of 1,616 narrative responses, whereas Figure 10.1.4b is a breakdown of all responses regardless of whether they provided a narrative about their choices. Out of the 2,484 respondents, 82.6% reported that the credibility of their work was “notably” or “extremely” substantiated through use of SGS and USGS geological maps.
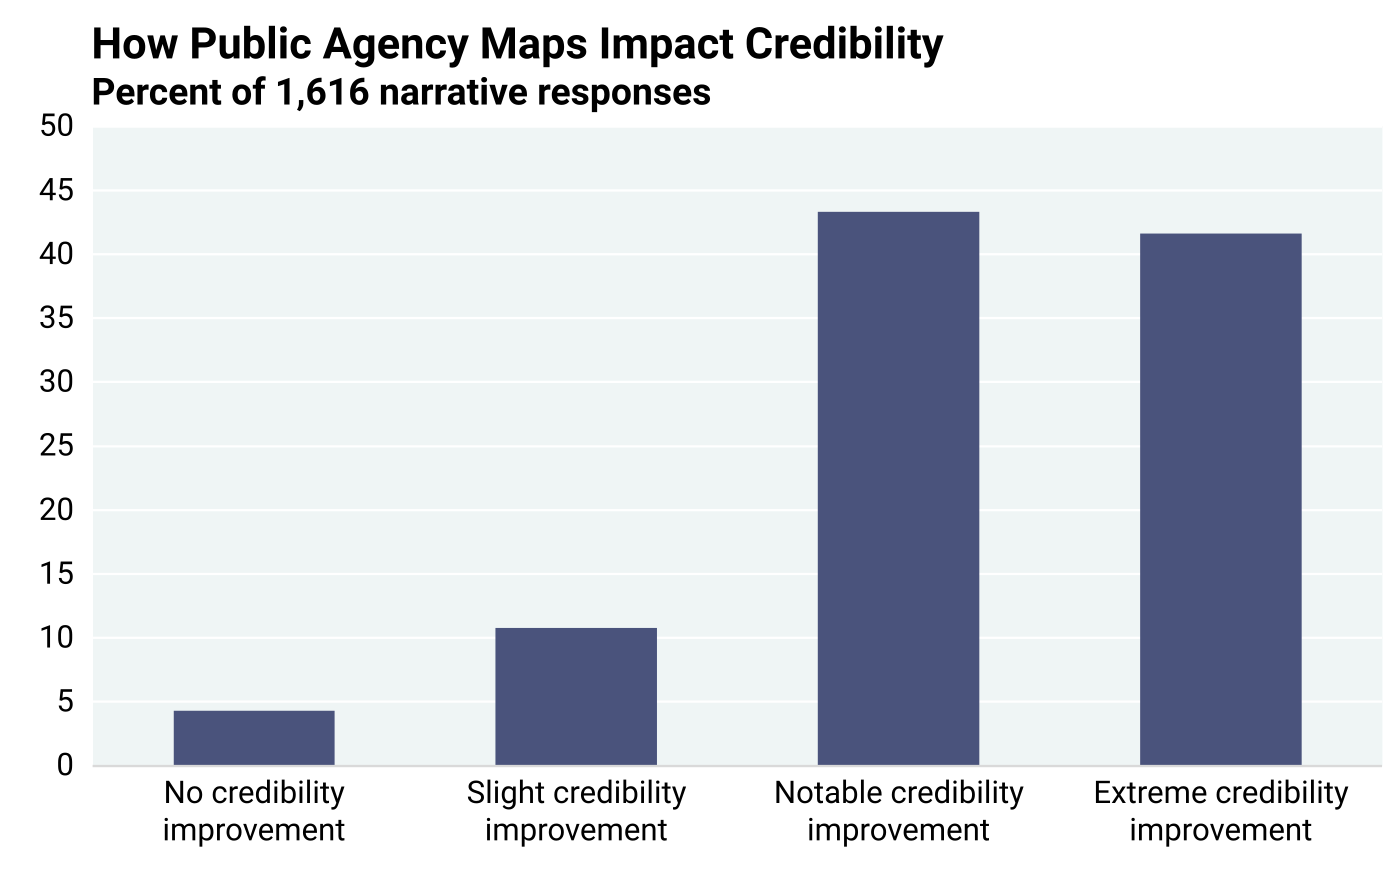
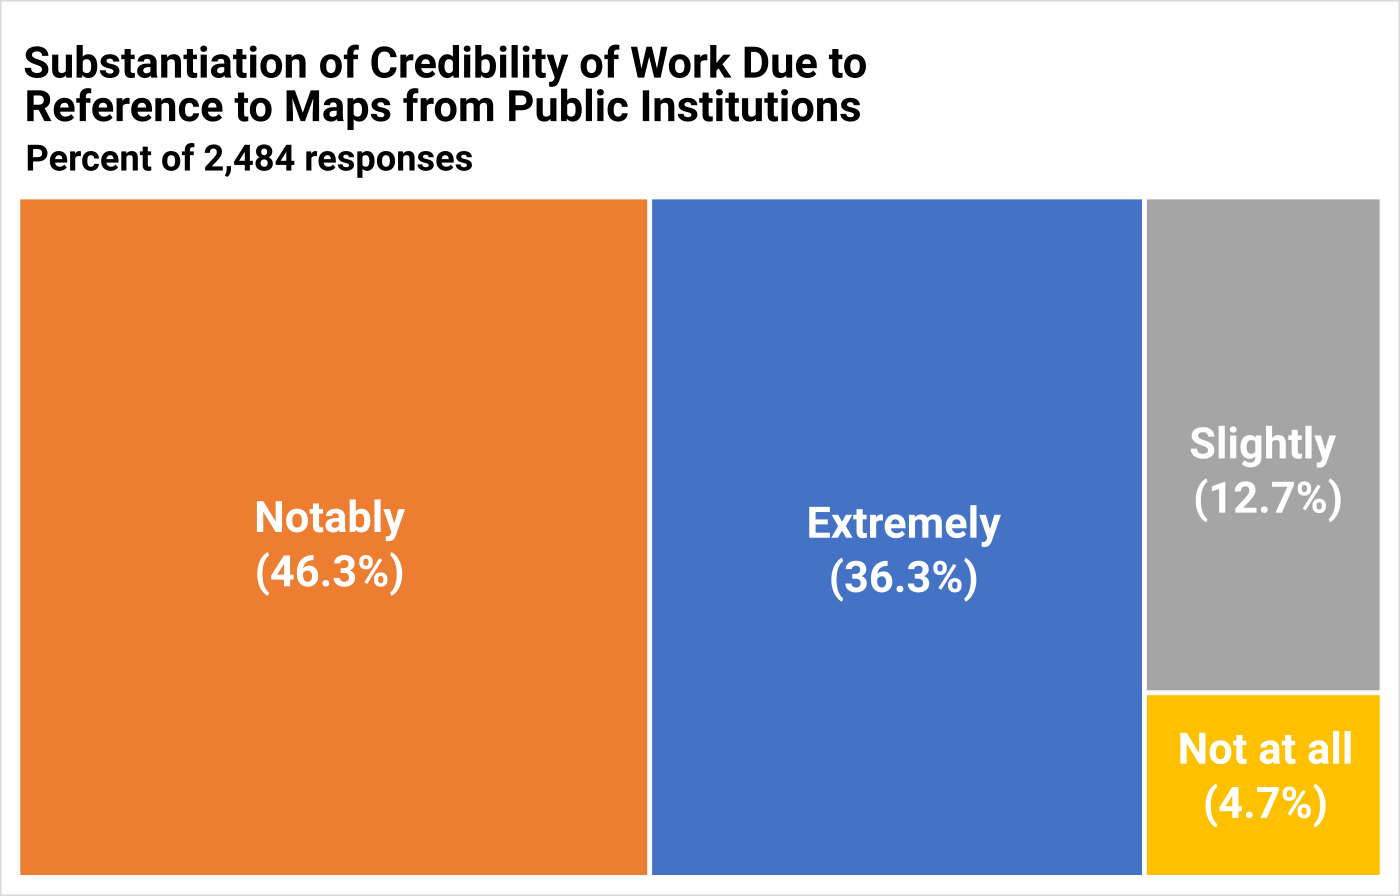
To further explain how credibility of stakeholder work benefits from the use of geological maps prepared by SGS and the USGS, 1,616 respondents provided comments. Table 10.1.1 shows a representative sample of responses.
Asked to describe “how” quality and accuracy of their work is influenced by the availability of geological maps, stakeholder responses were very diverse and difficult to analyze electronically. Individual responses had to be read and manually summarized. A total of 2,302 narrative responses to question 21 were provided regarding how the quality of their projects have been affected. Individual reading of the narratives provided a better sense of stakeholder views. Stakeholders described their experiences in many ways depending upon the nature of their project. However, the dominant and recurring descriptions could be summarized as follows:
Without regard to the sector, nature, and size of projects, the project sponsors are unable and/or unwilling to support the research needed to place the geology of the project area in the context of the regional geology for financial as well as time reasons. The contextualization of local geology with regional geology is critical for high-quality project planning and execution. It is therefore crucial to be able to rely on the quality of the regional geological information. The mission of publicly funded agencies is to create quality geological maps. They employ expert geologists who produce the maps and revise them over time as newer knowledge and/or technologies become available. High quality project planning needs the maps generated by them.
Qualitative assessments of geological maps may vary depending on who is using the maps and to which business or organization they belong. Stakeholders were asked for their assessment regarding the value of the geological maps produced by the publicly funded institutions for 20 different public and private entities and industries on a scale of 1 to 5, with 5 as the highest rating (question 22). These are assessments by the stakeholders for institutions and organizations for which they are not necessarily working. For all entities, the stakeholder assessments of the value of geological maps are in the upper half of the rating scale, between 3.3 and 4.5. (Figure 10.1.6)
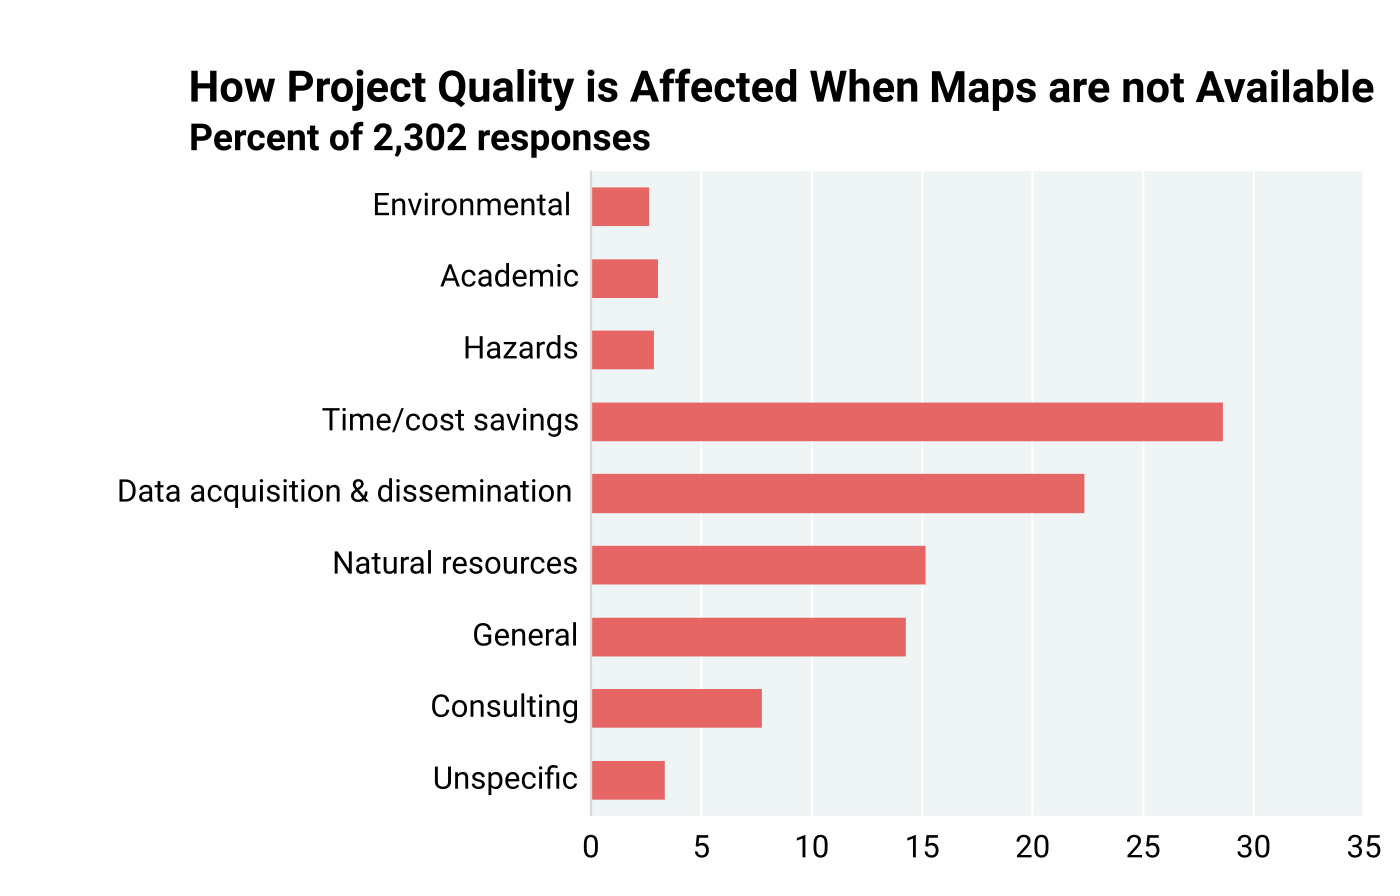
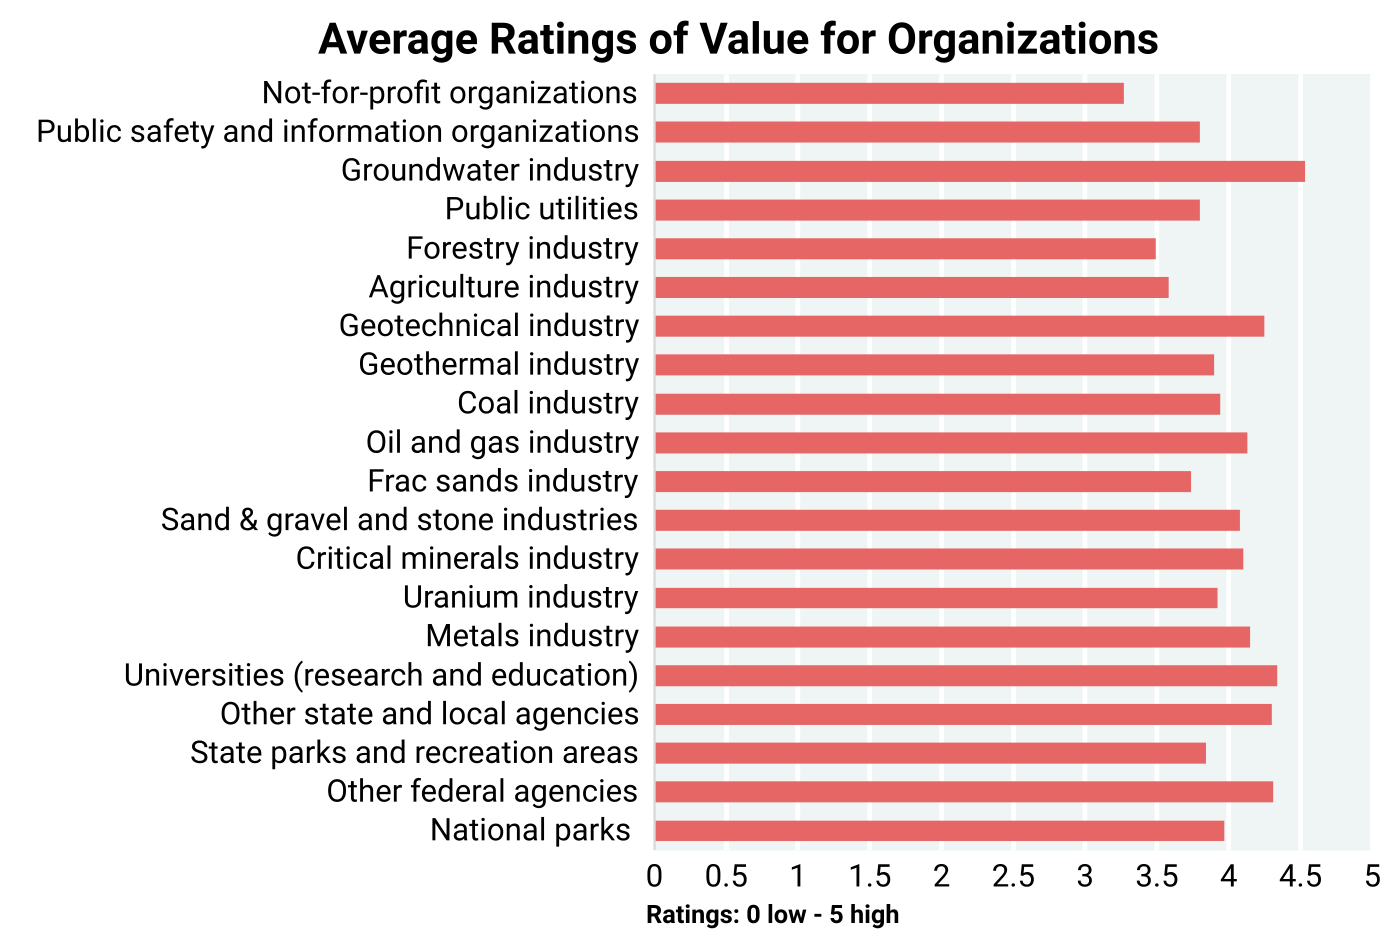
Table 10.1.1.
Summary of the qualitative narrative assessments of benefits of maps by stakeholders.
Question 6: How do geologic maps and information benefit your organization or industry?
| Identify resources. |
| Provide regional geologic context. |
| Aid construction safety. |
| Save time. |
| Save cost. |
| Aid grant writing. |
| Assist exploration planning. |
| Help regulatory compliance. |
| Hazard identification. |
| Aquifer recharge planning. |
| Assist environmental work. |
| Communication with public. |
| Educate students. |
Question 19B: How do geologic maps and the accompanying reports obtained from public institutions improve the quality and accuracy of your decisions?
| Consulting: |
|---|
| Clients can see results. |
| Decisions are substantiated visually. |
| Help verify field observations. |
| They enhance information for decision making. |
| Their accuracy helps in litigations. |
| Their high quality improves our quality. |
| Increases trust in our work. |
| Reference to public maps required for compliance work. |
| They help fill information gaps attributable to our investigative limitations. |
| Academic: |
|---|
| Academic uses are mainly in areas of research and teaching. |
| Most academic institutions have little or no resources to conduct their own mapping. |
| Accurate maps available from SGS and USGS determine the quality of teaching and research in academic institutions. |
| General: |
|---|
| Maps provide an overview of regional geology and a context to specific projects. |
| Maps are the basis of all projects. |
| Maps aid in all planning. |
| Data acquisition: |
|---|
| The large amount of available regional data provide basis for site specific data gathering operations. |
| The high-data quality of maps can be trusted because they are from trusted and independent geologists. |
| Regulatory agencies have no way of collecting their own data and must rely on available maps. |
| Natural resources: |
|---|
| Exploration and development of natural resources require accurate information to select targets and execute programs. |
| Publicly available and reliable geologic maps are fundamental to resource development. |
| Time savings: |
|---|
| Almost all respondents stated that availability of accurate maps from trusted sources save them a great deal of time and money. |
Question 20: How does map use substantiate credibility of your work?
| Provides us with a creditable reference. |
| Surveys are well respected and well known for the quality of their |
| work. |
| Gives academic credibility. |
| On numerous occasions, our clients have noted that they appreciate |
| our use of SGS or USGS produced maps. |
| Research reported by these institutions carries more weight than the |
| same information obtained during project work. |
| These maps are constructed by knowledgeable individuals whose work |
| is reviewed by peers and experts. |
| This information is of high value due in part to modern technology |
| and the time and effort put into the project. |
| Adds “outside expert” credibility. |
| Clients understand the value of a report that includes peer reviewed |
| research and comparisons from renowned institutions. |
| Helps drive home the point by respected offices. |
| They provide peer-reviewed maps created by knowledgeable |
| professionals. |
| Having maps and data from USGS, for example, provides level of |
| expertise and peer review that will hold up in court. |
| Information from these sources is used to confirm field |
| observations. |
| Regulatory agencies respect these resources. |
| In most times, the most accurate information available before |
| conducting our own site investigations. |
| Public peer-reviewed maps validate much of the assessment. |
| Peer-reviewed data adds to credibility. |
| These maps are universally recognized by the public, regulators, and |
| the courts. |
| The information provided is accurate. |
| Increases client trust. |
| Regulatory agencies value and trust the reports prepared by public |
| sources more than the work that we do. |
| Agencies responsible for approving mine design requires that |
| geologic statements be verified from a reliable source. |
| Review of geologic maps at the federal and state level have rigor. |
| Use of non-proprietary data is essential in maintaining the |
| shareability and transparency. |
| Site-specific data combined with regional data from a peer-reviewed |
| report/map provides credibility. |
| USGS and other federal and state geologic maps are very accurate. |
| Public data are used as the first level of QC when we receive data |
| from a client. |
| Federal, state, and academic institutions provide professional |
| services typically not influenced by project funding constraints. |
| More experienced mappers are non- or less- biased. |
| By providing information that I would not otherwise have. |
| Project saves time and clients’ money. |
| Helps to minimize the possible appearance of biases. |
Question 21: Give an example of how the quality of your project is affected when geological mapping is not available.
“Without regard to the sector, nature and size of projects, the project sponsors are unable and/or unwilling to support the research needed to place the geology of the project area in the context of the regional geology for financial as well as time reasons. The contextualization of local geology with regional geology is critical for high-quality project planning and execution. It is therefore crucial to be able to rely on the quality of the regional geological information. Publicly funded agencies’ missions are to create quality geological maps. They employ expert geologists who create the maps and revise them over time as newer knowledge and/or technologies become available. High-quality project planning needs the maps created by them.”
Question 22: Value of maps for various public and private entities in the judgment of responders. (Scale of 1: low — 5: high)
| National parks | 4.0. |
| Other federal agencies | 4.3. |
| State parks and recreation areas | 3.9. |
| Other state and local agencies | 4.3. |
| Universities (research and education) | 4.3. |
| Metals industry | 4.2. |
| Uranium industry | 3.9. |
| Critical minerals industry | 4.1. |
| Sand & gravel and stone industries | 4.1. |
| Frac sands industry | 3.8. |
| Oil and gas industry | 4.1. |
| Coal industry | 4.0. |
| Geothermal industry | 3.9. |
| Geotechnical industry | 4.3. |
| Agriculture industry | 3.6. |
| Forestry industry | 3.5. |
| Public utilities | 3.8. |
| Groundwater industry | 4.5. |
| Public safety and information organizations | 3.8. |
| Not-for-profit organizations | 3.3. |
Table of Contents
- Abstract
- Acknowledgements
- Executive Summary
- Chapter 1: Introduction
- Chapter 2: Study Objectives and Methodology
- Chapter 3: Stakeholder Assessment of Map Producing Agencies
- Chapter 4: Cost for Geological Mapping
- Chapter 5: Geological Mapping Program Activities — Critical Components
- Chapter 6: Benefits of Geological Mapping: Quantitative Assessment of Responses to Stakeholder Questionnaire
- Chapter 7: Geological Map Demand and Economic Estimates of Costs and Benefits
- Chapter 8: Regional Variations in Costs and Benefits of Geological Mapping
- Chapter 9: Quantitative Value Assessment from Independent EPA Data
- Chapter 10: Qualitative Assessment of Value of Geological Maps by Stakeholders
- Chapter 11: An Economic Model of General Geological Mapping Applications
- Chapter 12: Stakeholder Input about Future Geological Mapping
- Chapter 13: Lessons Learned and Suggestions for Future Analyses
- Chapter 14: Summary and Conclusions
- Appendix 1: Cost Sheet Template
- Appendix 2: Questionnaire to Stakeholders
- Appendix 3: Example Solication Letter Requesting Stakeholders to Participate in National Cost-Benefit Assessment
- Appendix 4: Summary Statistics, Outliers, and Confidence Intervals
- Appendix 5: Annual State Geological Survey Map Views
- Appendix 6: Regional Cost-Benefit Analysis Datasets
- Appendix 6a: Questionnaire Data Schema
- Appendix 6b: State Geological Survey Reporting Schema
- Appendix 7: Chapter 8 Supplemental Figures and Tables
