Chapter 12: Stakeholder Input about Future Geological Mapping
Abstract
Stakeholders asked to list priority geographical areas for future mapping indicated that it was useful in some cases to focus on geological phenomena such as karst or a commodity like water and minerals, which occur in many locations. Other stakeholders identified the Intermountain West, Great Lakes, and Pacific Rim regions for priority mapping. An important desired national focus was on urban areas. Mapping technologies have been changing, as have map applications. Stakeholders provided input on how mapping should evolve in the future, with digital maps and online access as the most frequently expressed priorities. Another suggestion included the need for revision of older maps. Some respondents also provided general input about various aspects of the questionnaire, saying for example that it was too long. Promotion of mapping skills at universities was reported as a future need. Collaboration with private industry and data coordination between various agencies at state and federal levels was suggested for improved efficiency. Finally, it was recommended that there should be a universal system of symbols and colors on geological maps representative of different lithologic types.
12.1: Stakeholder Input
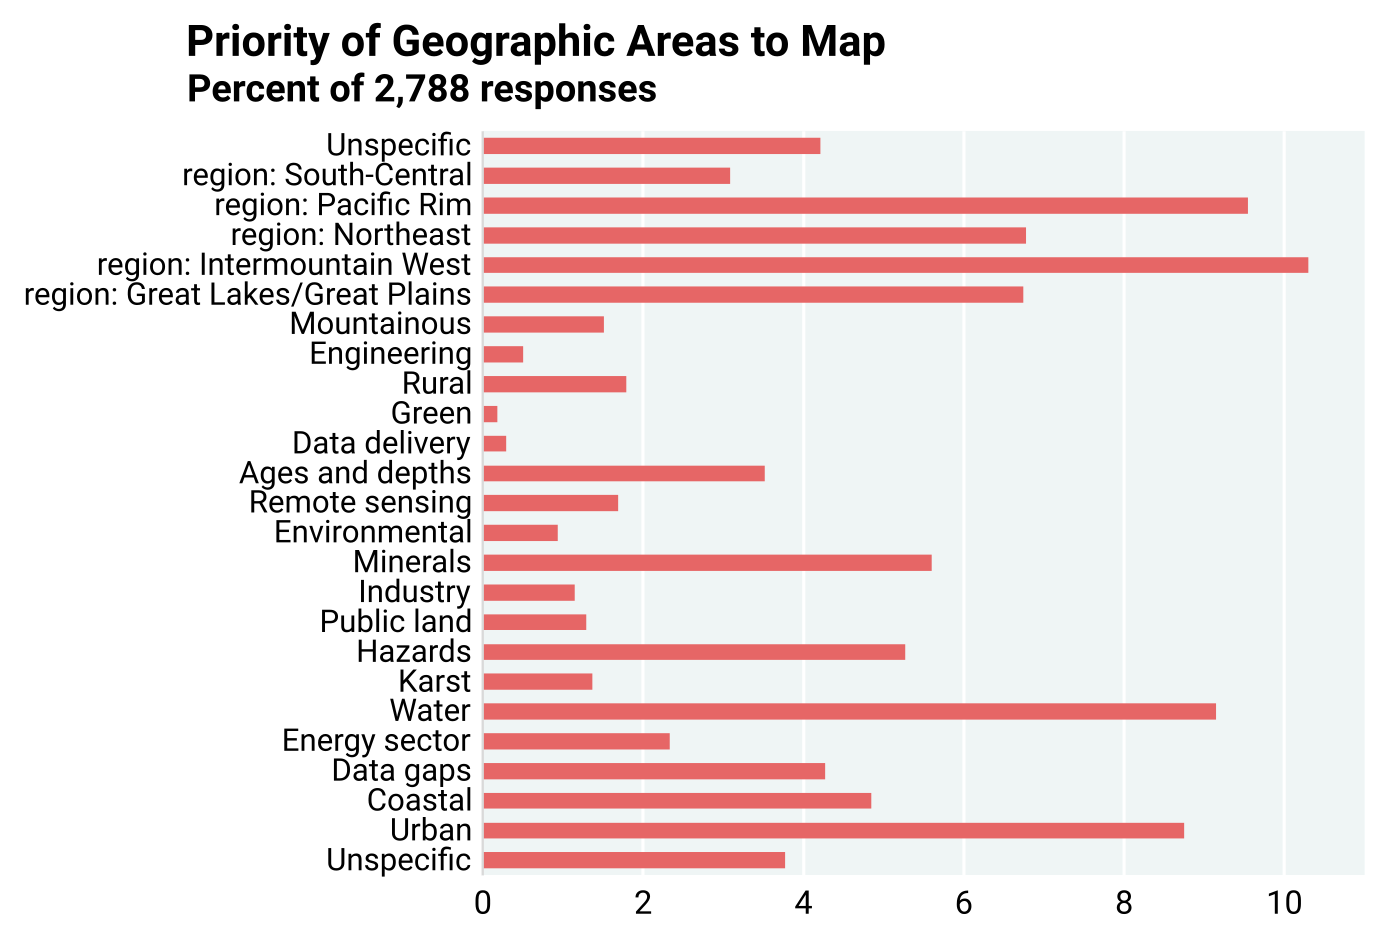
The stakeholder survey primarily focused on assessing how geological maps are used, what benefits they offer, and how map users judge their benefits both qualitatively and quantitatively. However, question 23 in the survey asked stakeholders to list priority geographic areas that should be mapped in the future. As publicly funded agencies that generate geological maps, it is necessary to direct future mapping efforts in accordance with user priorities. Figure 12.1.1 graphically presents their responses.

Stakeholders had a clear perspective of priorities as indicated by the small number (3.8%) of “unspecific” responses out of a total of 2,788. Their responses indicate that it is useful, in some cases, to focus on geological phenomena such as karst or a commodity like water and minerals, which occur in many locations. Accordingly, Figure 12.1.1 shows frequent reference to water, karst, hazards, and minerals in general. In addition, certain regions, such as the Intermountain West, the Great Lakes region, and the Pacific Rim have been identified for priority mapping. An important desired national focus is urban areas. Many stakeholders point out that adequate maps are not available in urban areas, where high-value construction takes place, flood hazards exist, and the use of accurate geological information is highly beneficial.
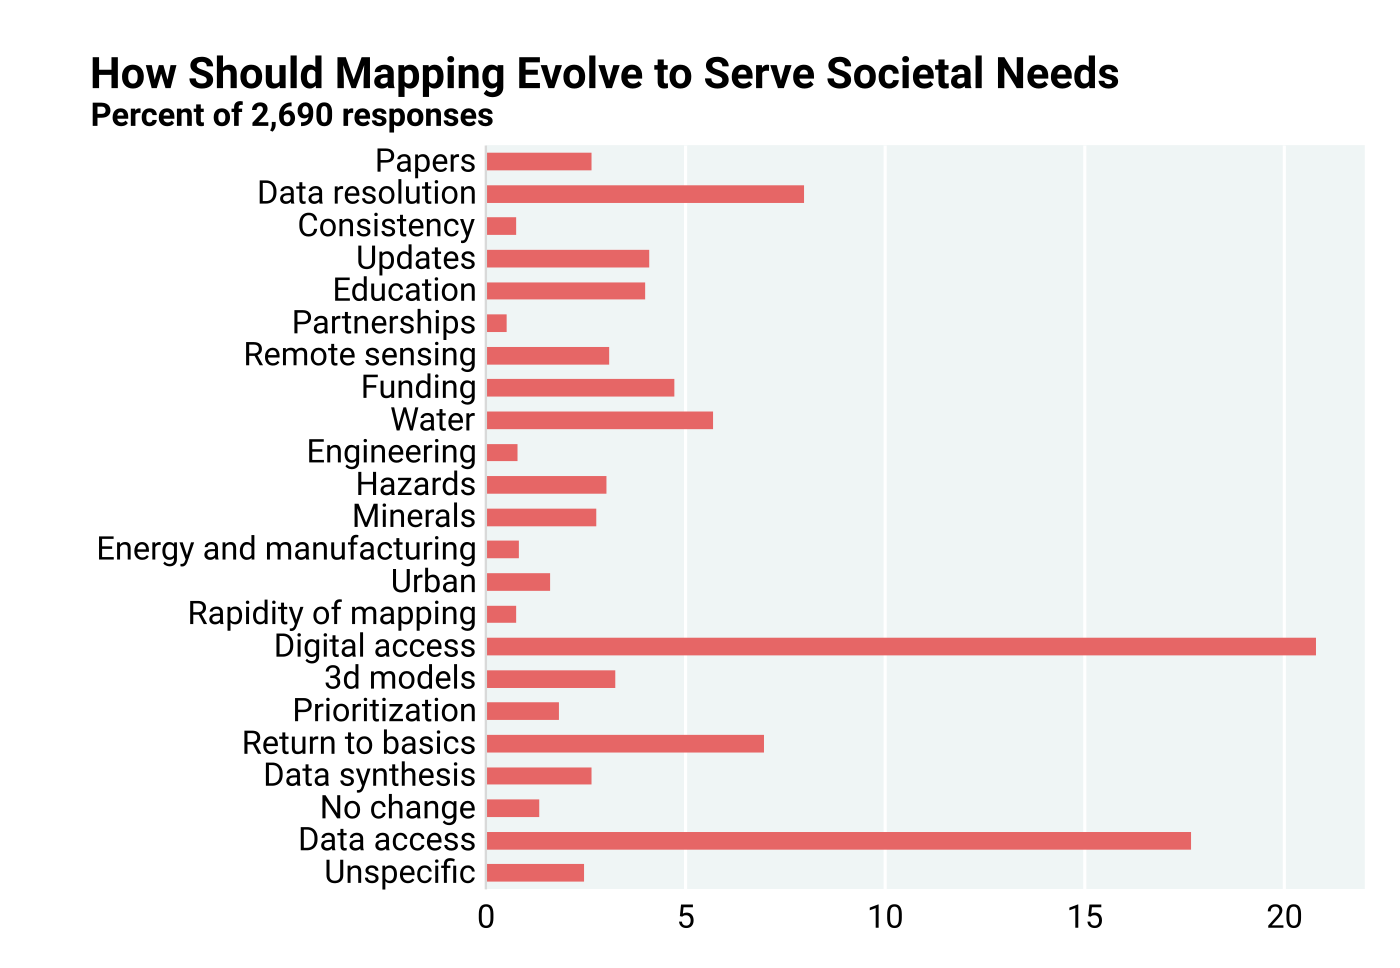
With advances in technology, as well as changing societal approaches to material consumption and environmental impacts of human activities, it is important to learn the views of map users on how future mapping should evolve (question 24). As Figure 12.1.2 shows, 1,516 respondents provided 2,690 suggestions. About 24.0% desired to see more digital and 3D models in the future. Online access to data is another preference by many, as shown in 17.7% of the responses.

Finally, 505 stakeholders (as summarized below) provided additional input in response to question 25, which asked for additional comments. The length of the survey was found to be too long by several respondents. Likewise, the difficulty assessing the monetary value of maps was highlighted. However, most respondents also realized that the diversity of geological maps and their applications made it inherently difficult to assign a value to maps in general. Continuous revision of maps was pointed out as essential, especially by respondents whose narratives referred to their many years of experience. In addition, several respondents found map accuracy to be lacking, which in their opinion is the result of a lack of emphasis on mapping skills in colleges and universities. In this context, a few commented that older maps were more accurate in some cases than newer ones and recommended that old data and map versions be preserved and made available online. Some important recommendations are summarized below:
-
Map revisions are extremely important.
-
Coordination and bringing together databases available at various agencies are needed.
-
Simplification of map downloading is desirable.
-
Collaboration with private industry for geological data in exchange for tax breaks is desirable.
-
Mapping skills are not being adequately nurtured at universities.
-
Increase communication with local authorities and educate them about map use.
-
Reach out to schools.
-
Preserve old maps and data, make them available online, and build on it.
-
Make sure that State Geological Surveys and the U.S. Geological Survey do not intend to charge more for maps.
-
A universal system of symbology and colors to represent different lithologic types on geologic maps would be most appreciated!
-
Introduce quality controls in mapping with field verifications.
Table of Contents
- Abstract
- Acknowledgements
- Executive Summary
- Chapter 1: Introduction
- Chapter 2: Study Objectives and Methodology
- Chapter 3: Stakeholder Assessment of Map Producing Agencies
- Chapter 4: Cost for Geological Mapping
- Chapter 5: Geological Mapping Program Activities — Critical Components
- Chapter 6: Benefits of Geological Mapping: Quantitative Assessment of Responses to Stakeholder Questionnaire
- Chapter 7: Geological Map Demand and Economic Estimates of Costs and Benefits
- Chapter 8: Regional Variations in Costs and Benefits of Geological Mapping
- Chapter 9: Quantitative Value Assessment from Independent EPA Data
- Chapter 10: Qualitative Assessment of Value of Geological Maps by Stakeholders
- Chapter 11: An Economic Model of General Geological Mapping Applications
- Chapter 12: Stakeholder Input about Future Geological Mapping
- Chapter 13: Lessons Learned and Suggestions for Future Analyses
- Chapter 14: Summary and Conclusions
- Appendix 1: Cost Sheet Template
- Appendix 2: Questionnaire to Stakeholders
- Appendix 3: Example Solication Letter Requesting Stakeholders to Participate in National Cost-Benefit Assessment
- Appendix 4: Summary Statistics, Outliers, and Confidence Intervals
- Appendix 5: Annual State Geological Survey Map Views
- Appendix 6: Regional Cost-Benefit Analysis Datasets
- Appendix 6a: Questionnaire Data Schema
- Appendix 6b: State Geological Survey Reporting Schema
- Appendix 7: Chapter 8 Supplemental Figures and Tables
