
Why Landslide Maps Show Susceptibility, Not Certainty
Explains why landslide susceptibility maps show relative likelihood, not exact predictions of when or whether a specific site will fail.
Landslide maps often show susceptibility, which means areas are more or less likely to experience landslides based on known conditions. They do not usually predict exactly when a landslide will happen or whether a specific site will fail.
This matters for policy because susceptibility maps are decision-support tools, not guarantees. They help with screening, planning, communication, and prioritization, but parcel-level decisions may still require site-specific investigation, geotechnical review, and clear communication about uncertainty.
Download or reuse this guide in briefings and meeting materials.
Why Landslide Maps Show Susceptibility, Not Certainty
Landslide maps often show susceptibility, which means relative likelihood based on known conditions. They can help identify where landslides are more or less likely, but they usually do not predict exactly when a landslide will happen or whether a specific site will fail.
This distinction matters because maps are often used to guide planning, communication, permitting, and funding decisions. A mapped zone indicates potential, not certainty.
What the visual shows
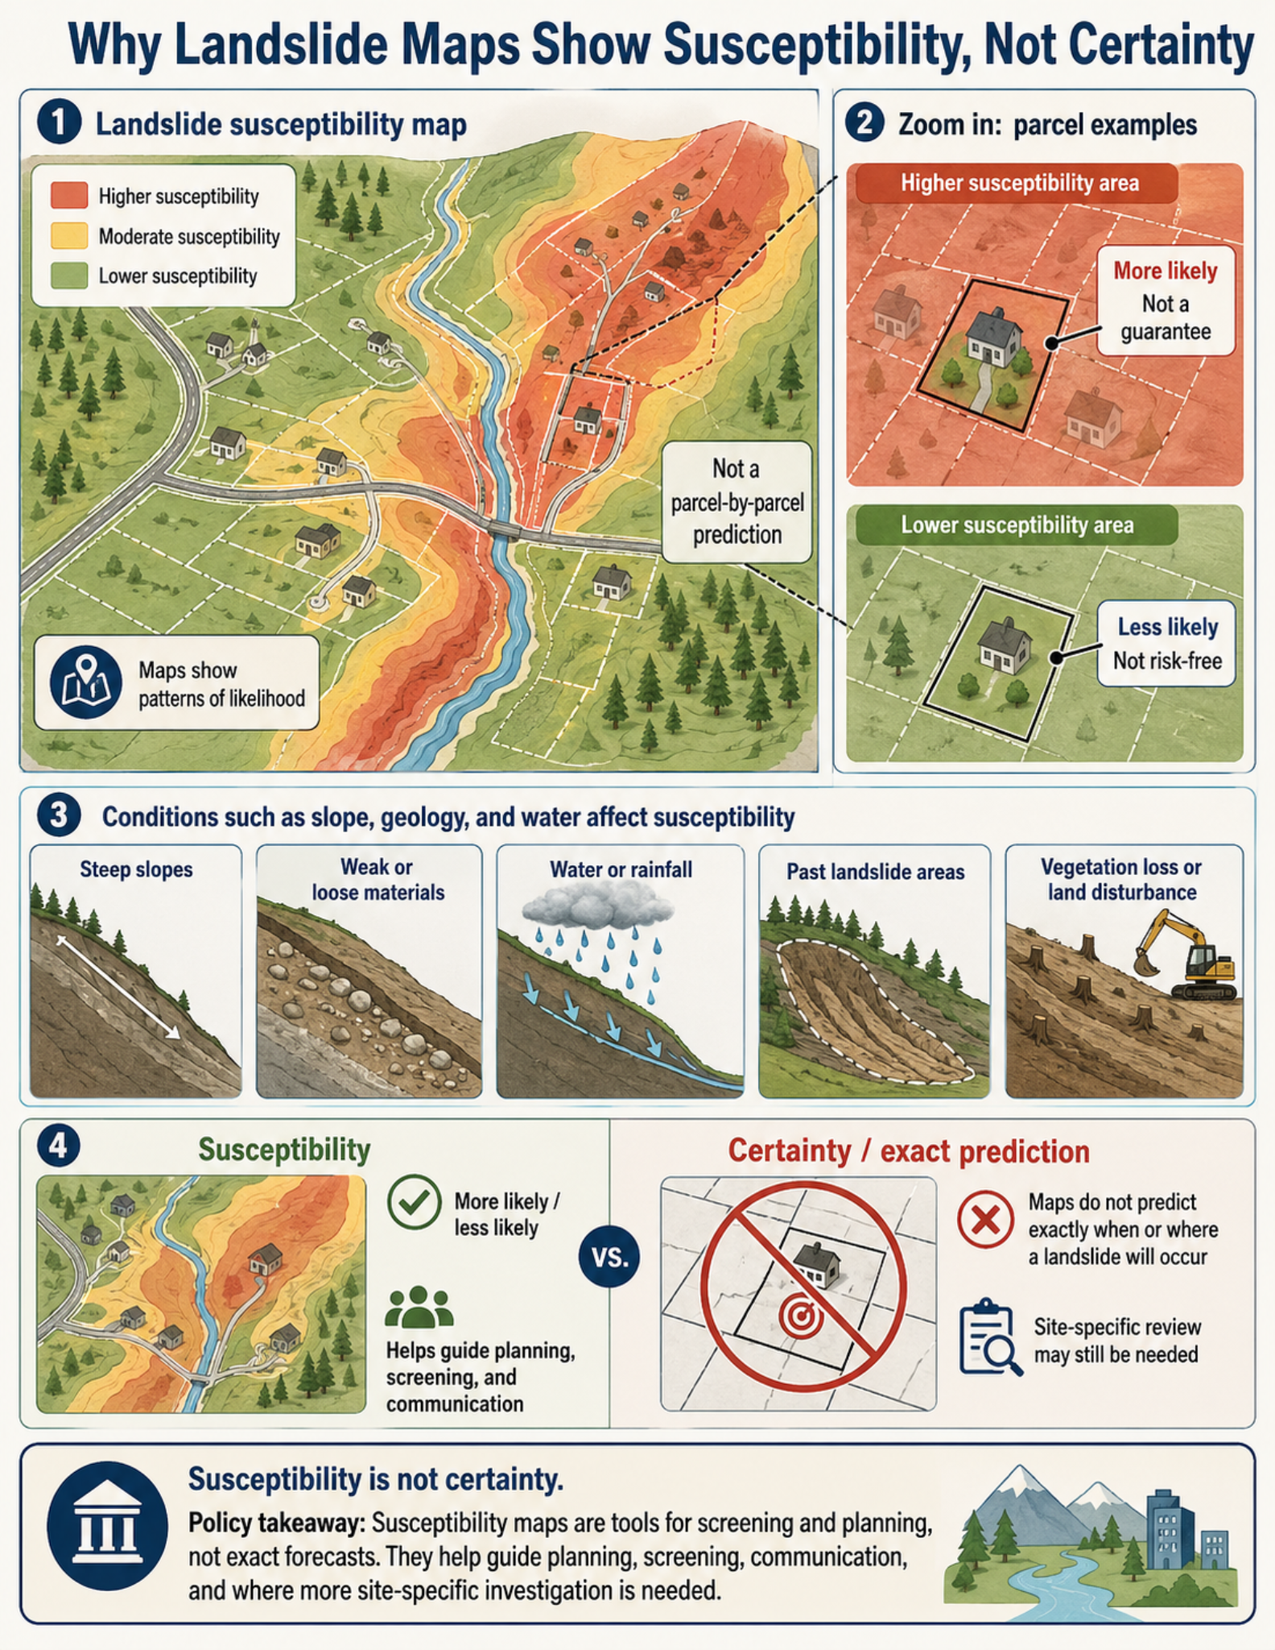
The visual shows a simplified landslide susceptibility map with three categories: lower susceptibility, moderate susceptibility, and higher susceptibility. Roads, parcels, buildings, trees, and a stream are included so the map connects to real planning decisions.
The map shows patterns of likelihood. Areas marked as higher susceptibility are more likely to experience landslide problems than areas marked as lower susceptibility. But the map is not a parcel-by-parcel prediction.
A zoomed-in parcel example shows a property inside a higher-susceptibility area. That property is more likely to have landslide problems than a similar property in a lower-susceptibility area, but failure is not guaranteed.
A second zoomed-in example shows a property inside a lower-susceptibility area. That property is less likely to have landslide problems, but it is not risk-free.
The visual also shows some conditions that affect landslide susceptibility. These include steep slopes, weak or loose materials, water or rainfall, past landslide areas, and vegetation loss or land disturbance.
The final comparison panel explains that susceptibility is not the same as certainty. Susceptibility maps help show where landslides are more or less likely, but they do not usually predict exactly when or where a landslide will occur. Site-specific review may still be needed.
Why this matters for policy
Landslide susceptibility maps are useful screening and planning tools. They can help agencies identify areas where caution is warranted, where additional review may be needed, and where communication with residents or developers should be clear.
However, susceptibility maps should not be treated as exact forecasts. A higher-susceptibility area is not a guarantee that every parcel will fail. A lower-susceptibility area is not the same as a no-risk area.
Map scale matters. A regional or countywide map may be useful for planning, communication, and prioritization, but it may not show enough detail for a single parcel, road segment, building site, or infrastructure project. Local geology, drainage, slope shape, land disturbance, and site history can all matter at smaller scales.
This is why site investigations and geotechnical review may still be needed. A professional review can evaluate local slope conditions, soil and rock materials, groundwater, drainage, prior movement, and proposed construction.
The distinction between susceptibility and certainty also matters for public communication. If agencies describe a mapped zone as a prediction, people may misunderstand the map. If a landslide does not occur, the map may seem wrong. If a landslide happens outside a high-susceptibility zone, the public may lose trust. Clear communication about uncertainty helps people understand what the map can and cannot say.
For policy staff, the key message is that susceptibility maps support decisions. They do not replace professional review, local knowledge, or updated information.
Key terms
Landslide susceptibility
The relative likelihood that an area could experience landslides based on known conditions. Susceptibility is often shown as categories such as lower, moderate, or higher.
Relative likelihood
A comparison of which areas are more likely or less likely to experience landslides. It does not mean a precise prediction for a specific parcel.
Probability
A measure of chance. Some landslide products may estimate probability, but many susceptibility maps show relative categories rather than exact probabilities.
Uncertainty
The limits of what is known. Landslide maps may be uncertain because of limited data, changing conditions, map scale, or local site differences.
Map scale
The level of detail shown on a map. A broad regional map may not be detailed enough for parcel-level decisions.
Site-specific investigation
A closer review of conditions at a particular site. This may include field inspection, soil or rock testing, groundwater review, drainage evaluation, and review of past landslide evidence.
Geotechnical review
Technical evaluation by qualified professionals of soil, rock, groundwater, slope, and foundation conditions.
Slope angle
How steep a slope is. Steeper slopes are often more susceptible to landslides than gentler slopes.
Geology
The type, structure, and condition of rock and soil beneath the ground surface. Some geologic materials are more prone to landslides than others.
Water conditions
The amount and movement of water in or across a slope. Rainfall, groundwater, drainage, irrigation, and runoff can affect susceptibility.
Past landslide area
A location where landsliding has occurred before. Some past landslide areas may be more likely to move again.
Questions policy staff can ask
- What does this map show: susceptibility, hazard, probability, risk, or something else?
- Does the map show relative categories, such as lower, moderate, and higher susceptibility?
- What factors were used to make the map, such as slope angle, geology, rainfall, land cover, or past landslides?
- What is the map scale, and is it detailed enough for the decision being made?
- Is the map appropriate for parcel-level decisions, or is it intended for broader screening and planning?
- Does a higher-susceptibility zone mean more likely, rather than guaranteed failure?
- Does a lower-susceptibility zone mean less likely, rather than no risk?
- Are there local conditions that could change the interpretation, such as drainage problems, grading, wildfire, erosion, or previous ground movement?
- Is a site-specific investigation or geotechnical review needed?
- How should uncertainty be explained to residents, decision-makers, developers, or emergency managers?
- How will the map be used in permitting, disclosure, land-use planning, mitigation prioritization, or public communication?
- Are there plans to update the map as new data, storms, fires, landslides, or development changes occur?
Policy takeaway
Landslide maps help show where caution is warranted, but they do not function as exact predictions. Good policy uses them as decision-support tools, alongside site-specific information and clear communication about uncertainty.
Main concept: Landslide susceptibility maps show relative likelihood, not certainty.
Core message: Susceptibility maps identify areas where landslides are more or less likely based on conditions such as slope angle, geology, water, land cover, and past landslides. They do not usually predict exactly when a landslide will happen or whether a specific parcel will fail.
Susceptibility map: The main visual shows lower, moderate, and higher susceptibility zones. Roads, buildings, parcels, and a stream are included to connect the map to planning decisions.
Parcel examples: A higher-susceptibility parcel is labeled as more likely, but not a guarantee. A lower-susceptibility parcel is labeled as less likely, but not risk-free.
Influencing conditions: The visual shows steep slopes, weak or loose materials, water or rainfall, past landslide areas, and vegetation loss or land disturbance as factors that can affect susceptibility.
Susceptibility versus certainty: The visual contrasts susceptibility maps, which show more-likely and less-likely areas, with exact predictions, which most landslide maps do not provide.
Site-specific review: The visual notes that site-specific review may still be needed, especially for parcel-level decisions.
Policy takeaway: Landslide maps help show where caution is warranted, but they do not function as exact predictions. Good policy uses them as decision-support tools, alongside site-specific information and clear communication about uncertainty.