
Hazard, Exposure, and Risk Are Not the Same
Explains the difference between hazard, exposure, vulnerability, and risk using land-instability examples.
Hazard, exposure, vulnerability, and risk are related, but they do not mean the same thing. Unstable ground is the hazard; people and infrastructure create exposure; and risk depends on the likelihood and consequences of harm.
This distinction matters for public communication, land-use decisions, mitigation prioritization, and funding decisions. Clear use of these terms helps agencies explain maps, compare places, and decide where risk-reduction actions are most needed.
Download or reuse this guide in briefings and meeting materials.
Hazard, Exposure, and Risk Are Not the Same
Hazard, exposure, vulnerability, and risk are related, but they do not mean the same thing. Unstable ground is the hazard; people and infrastructure create exposure; and risk depends on the likelihood and consequences of harm.
Using these terms clearly helps agencies explain land-instability information more accurately. A place can have a hazard but low risk if little or nothing is exposed, while a similar hazard can create higher risk where homes, roads, utilities, or essential services are in harm’s way.
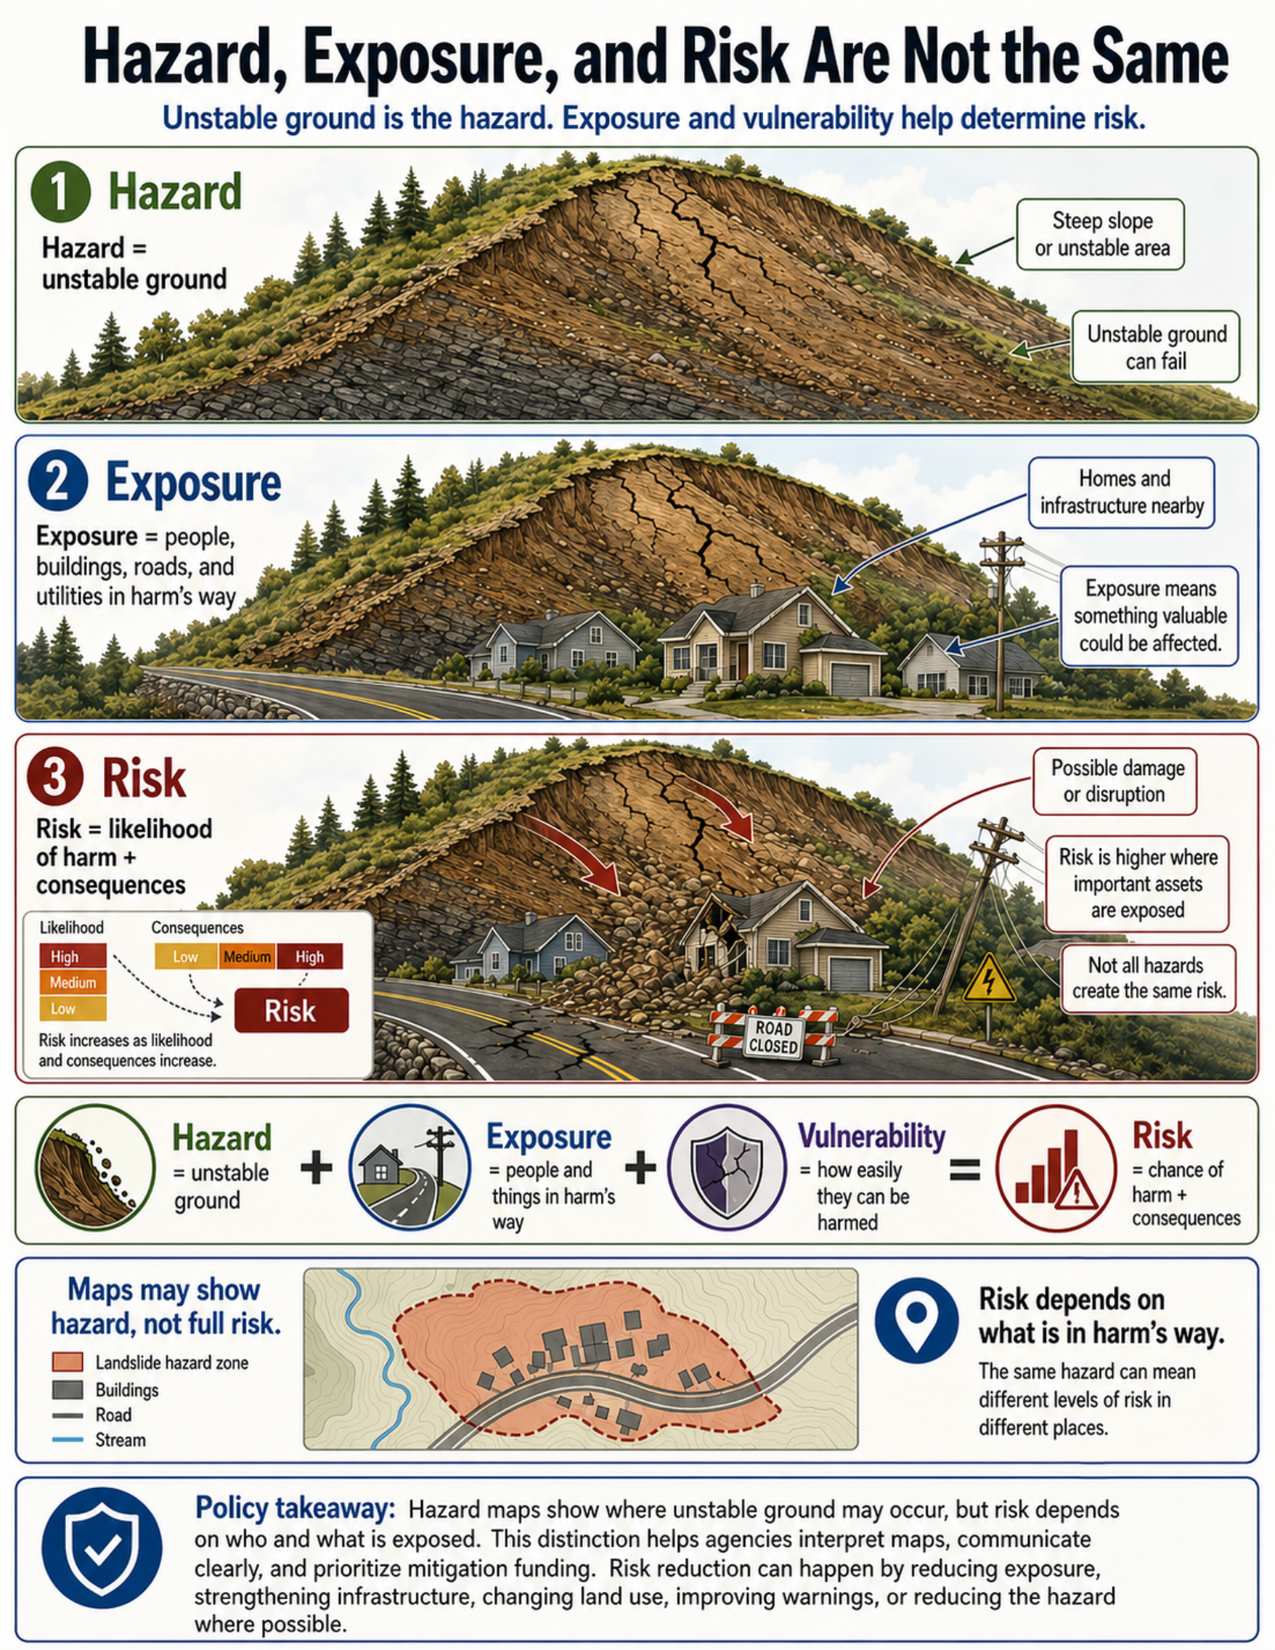
What the visual shows
The visual uses the same landslide-prone slope in three panels to show the difference between hazard, exposure, and risk.
The first panel shows hazard. The slope is steep, cracked, and potentially unstable. This unstable ground is the hazard, even though no people, homes, roads, or utilities are directly in harm’s way.
The second panel shows exposure. The same unstable slope is now shown with homes, a road, and utilities nearby. The hazard has not necessarily changed, but something valuable has been placed where the hazard could affect it.
The third panel shows risk. The unstable slope has failed, and debris has damaged homes, blocked a road, and affected utilities. This panel shows that risk involves both the chance that harm could occur and the consequences if it does.
The visual also includes a simple formula: hazard + exposure + vulnerability = risk. Vulnerability means how easily exposed people, buildings, infrastructure, or services can be harmed.
A map inset shows a landslide hazard zone overlaid with buildings, a road, and a stream. The map helps show that hazard maps may identify where unstable ground could occur, but they do not always show the full picture of exposure, vulnerability, or consequences.
Why this matters for policy
Hazard maps are useful, but they are not the same as risk maps. A hazard map may show where unstable ground, sinkhole-prone terrain, subsidence, coastal bluff retreat, or riverbank erosion could occur. It may not show who lives there, what infrastructure is present, how important those assets are, or how easily they could be damaged.
This distinction matters for public communication. Saying that an area has a hazard does not automatically mean that the risk is high. Likewise, an area with a moderate hazard may have high risk if critical infrastructure, emergency routes, public facilities, or dense housing are exposed.
Two places with similar hazards can have very different levels of risk. A remote unstable slope may pose limited risk if no one is nearby. A similar slope above a road, school, utility corridor, or neighborhood may pose much higher risk because the consequences of failure would be greater.
Clear use of these terms also matters for mitigation and funding decisions. Agencies may reduce risk by avoiding new exposure, changing land use, improving infrastructure resilience, strengthening buildings or lifelines, warning people earlier, or reducing the hazard where possible.
For planning and emergency management, the key question is not only, “Where could unstable ground occur?” It is also, “Who and what could be affected, how vulnerable are they, and what would the consequences be?”
Key terms
Hazard
A potentially damaging physical process or condition. In land-instability work, examples include an unstable slope, sinkhole-prone ground, a subsidence area, an eroding riverbank, a coastal bluff, or a rockfall-prone cliff.
Exposure
The people, homes, roads, utilities, public facilities, businesses, emergency routes, and other assets located where a hazard could affect them.
Vulnerability
How easily exposed people, infrastructure, or services could be harmed. A building, road, bridge, pipeline, or utility system may be more or less vulnerable depending on design, condition, age, maintenance, and ability to withstand ground movement.
Risk
The likelihood and consequences of harm. Risk depends on the hazard, what is exposed, how vulnerable those assets are, and what the consequences would be if damage occurred.
Consequence
The result of a damaging event. Consequences can include injuries, evacuations, property damage, road closures, utility outages, service disruptions, repair costs, or loss of access.
Likelihood
The chance that a damaging event or condition may occur over a given time period.
Hazard map
A map showing where a hazard may occur or where physical conditions are favorable for a hazard. A hazard map may not show the full pattern of exposure, vulnerability, or consequences.
Mitigation
Actions that reduce future harm. Examples include avoiding development in hazardous areas, improving drainage, strengthening infrastructure, using setbacks, relocating assets, installing warning systems, or reducing the hazard where possible.
Questions policy staff can ask
- What is the physical hazard at this location?
- Is the hazard an unstable slope, sinkhole-prone ground, subsidence area, eroding riverbank, coastal bluff, or another land-instability concern?
- Who or what is exposed to the hazard?
- Are homes, roads, utilities, public facilities, schools, hospitals, emergency routes, or essential services in the hazard area?
- How vulnerable are the exposed assets?
- Would the likely consequences include road closures, utility outages, property damage, evacuation, loss of access, or public-safety impacts?
- Does the available map show hazard only, or does it also account for exposure and consequences?
- Are there similar hazard areas with different levels of exposure and risk?
- Could risk be reduced by avoiding new exposure or changing land use?
- Could risk be reduced by strengthening infrastructure, improving drainage, using setbacks, or maintaining slopes?
- Are warning systems, emergency plans, or public communication materials needed?
- How should mitigation funding be prioritized when several areas have similar hazards but different exposure and consequences?
Policy takeaway
Hazard is not the same as risk. Good policy decisions depend on understanding both where unstable ground exists and what people, infrastructure, and services could be affected.
Main concept: Hazard, exposure, vulnerability, and risk are related but different concepts.
Core message: A hazard is a potentially damaging physical process or condition. Exposure exists when people, buildings, roads, utilities, or other assets are located where the hazard could affect them. Risk depends on the likelihood and consequences of harm.
Hazard: The first panel shows an unstable slope with cracks and steep ground. No homes, roads, or utilities are directly in the hazard area.
Exposure: The second panel shows the same unstable slope with homes, a road, and utilities below it. The physical hazard is similar, but people and infrastructure are now in harm’s way.
Risk: The third panel shows slope failure affecting the exposed homes, road, and utilities. The consequences include damage, disruption, and a road closure.
Formula: The visual summarizes the relationship as hazard plus exposure plus vulnerability equals risk.
Map interpretation: The visual notes that maps may show where a hazard exists, but they do not always show the full picture of exposure, vulnerability, or consequences.
Policy takeaway: Hazard is not the same as risk. Good policy decisions depend on understanding both where unstable ground exists and what people, infrastructure, and services could be affected.